KAVA/BTC Technical Analysis
KAVA/BTC has been in a downtrend since Aug 2024, dropping from 0.0000400 to 0.0000100 BTC. However, recent signs point to a potential short-term reversal:
Price: Showing a slight uptick with a projected upward trend targeting 0.0000160, 0.0000180, 0.0000220, 0.0000260, and 0.0000300 BTC.
Ichimoku
Related coins

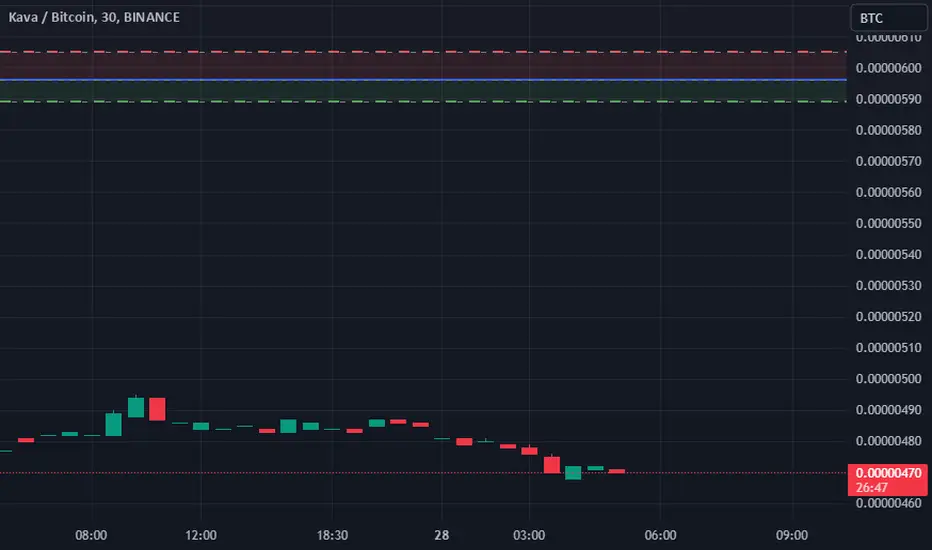
KAVABTC Trading Signal: Sell OpportunityDear Traders,
We have identified a potential trading opportunity for the KAVABTC pair. Our analysis indicates a Sell signal. Here are the specific details for your consideration:
- Direction : Sell
- Enter Price : 5.96E-06
- Take Profit : 5.89E-06
- Stop Loss : 6.05E-06
Our forecast is base
Kava | Triple Bottom (The Altcoins Are Heating Up!)Kava is making a decisive move just now as financial independence day comes to a close.
Here we can see a "bottom" being tested three times before a bullish breakout develops.
➖ KAVABTC hit bottom 5-August. This same low is tested again 4-September and then again yesterday. Needless to say, every

✳️ Kava Moving Above MA200, Major Bullish PotentialOnce the bottom is hit, the only place left to go is up.
The lower it goes the better it gets.
The stop-loss being activated is good news; no more sellers, only buyers remain.
A steep decline is matched by a steep rise; fast down, fast up.
The market goes up and down, up and down... KAVABTC went

KAVA/BTC - Kava: Resistance_Breakout_Confirmation◳◱ A Resistance Breakout and Confirmation has been detected on the CRYPTOCAP:KAVA / CRYPTOCAP:BTC chart. The price has broken above a key resistance level and has been confirmed by a strong candle, indicating a potential bullish trend. The next resistance key levels are located at 0.00004299 | 0

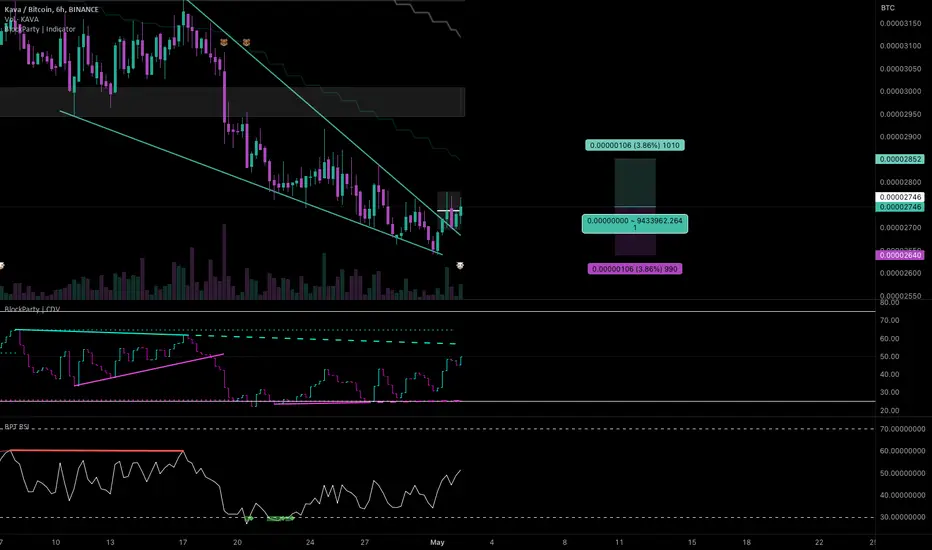
#KAVA/BTC - Long - Potential 3.86%Direction: Long
Market: Spot
Risk: 0.25% - 1%
#BTC_KAVA
Exchange: BINANCE
Timeframe: 360
TP1: 0.00002852
Entry: 0.00002746
STOP: 0.0000264
Entry Conditions:
| Falling wedge breakout
| Volume confirmed
✳️ Take This! 111.11% Potential For KavaI like the look of this chart. I am giving you a nice 111.11% potential on this trading pair.
See a bullish crossover on the MACD
✔️ The MACD line (blue) crosses over the Signal line (orange) to the upside.
✔️ The candles 4-Mar. and 7-Mar. both represent reversal signals based on Candlestick r

✳️ Kava Rebound Points To Easy 40%, Up To 100% PossibleWe found this one thanks to TradingView community on the front page... Very smart individuals we have in this community... They know exactly what to look for... Thank you!
Kava vs Bitcoin (KAVABTC) went oversold on the RSI for the second time in less than two months.
At the same time this is happe

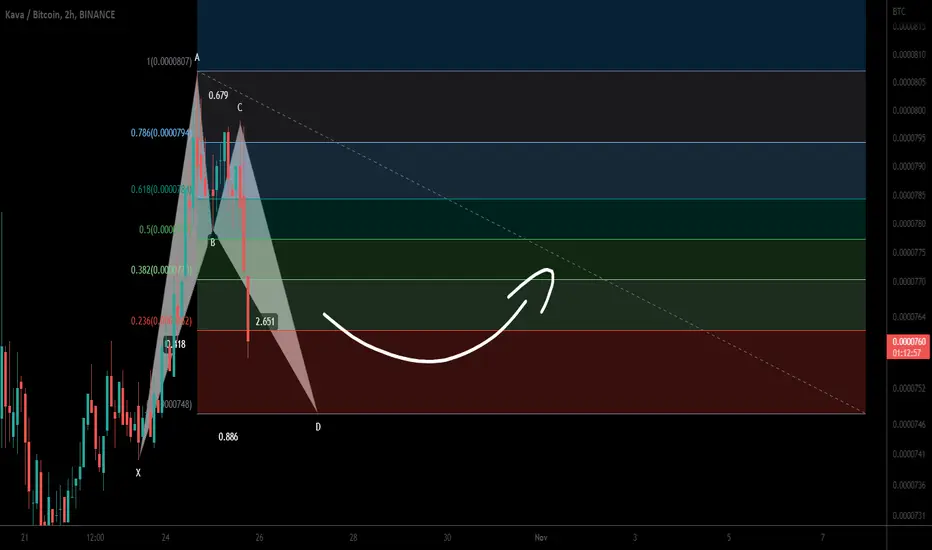
Kava. io forming bullish BAT | A good buying opportunityHi dear friends, hope you are well and welcome to the new trade setup of Kava. io (KAVA) token with Bitcoin pair.
Previously the priceline slightly moved down but recovered soon and pumped well.
Now on a 2-hr time frame, KAVA is completing a bullish BAT pattern.
Note: Above idea is for educati
KAVABTCHello Crypto Lovers,
Mars Signals team wishes you high profits.
This is a 4-hour-time frame analysis for KAVABTC
In the present chart, we have R2 and R1 as are our resistance areas that represent the disability of the price to rise. And S1 is the support line which includes the support of the pri

See all ideas
Summarizing what the indicators are suggesting.
Oscillators
Neutral
SellBuy
Strong sellStrong buy
Strong sellSellNeutralBuyStrong buy
Oscillators
Neutral
SellBuy
Strong sellStrong buy
Strong sellSellNeutralBuyStrong buy
Summary
Neutral
SellBuy
Strong sellStrong buy
Strong sellSellNeutralBuyStrong buy
Summary
Neutral
SellBuy
Strong sellStrong buy
Strong sellSellNeutralBuyStrong buy
Summary
Neutral
SellBuy
Strong sellStrong buy
Strong sellSellNeutralBuyStrong buy
Moving Averages
Neutral
SellBuy
Strong sellStrong buy
Strong sellSellNeutralBuyStrong buy
Moving Averages
Neutral
SellBuy
Strong sellStrong buy
Strong sellSellNeutralBuyStrong buy
Displays a symbol's price movements over previous years to identify recurring trends.