KAVA/BTCKAVA seems like a good opportunity for long.
Buy 7731 - 8176sats
TP1=9460sats
TP2=11409sats
TP3=14745sats
TP4=19596sats
TP5=35177sats
.
SL=5611sats (cca 30%)
,
Not financial advice it is just a note for myself.
KAVABTC trade ideas

TRADE 8 - KAVA / BTCHi guys,
This time i think KAVA it's a good trade. DEFI with a lot to grow and mainnet in march with a bullish Market structure on the daily.
Price is inside the cloud with bullish TK cross, retesting the 0.786 fib level from the move up with matches with weekly support.
RSI is around 50 level.
Target daily ob and monthly resistance.
Entry is a bit lower since i'm expecting a last push down to the tenkan with is pretty near the actual daily low on the MS.
I always post the charts with a entry price and target, but have in mind this is not financial advice. Anyway, remember that taking a trade is less improtant than manage it propertly. Scalate in and out, try to anticipate the market and dont let unrealized profits become a loss.


Crypto|KAVA/BTC|LongLong KAVA/BTC
Activation of the transaction only when the blue zone is fixed/broken.
The idea is to work out the resistance level .
* Possible closing of a trade before reaching the take/stop zone. The author can close the deal for subjective reasons, this does not completely cancel the idea and is not a call to the same action, you can continue working out the idea according to your data, but without the support of the author.
+ Maybe right now we will go even lower, then it's okay, the idea is not activated and simply canceled.
+ ! - zone highlighted by the ellipse is a zone of increased resistance, in this area there is a possible reversal for a correction, please take this factor into account in this transaction.
The "forecast" tool is used for more noticeable display of % (for the place of the usual % scale) of the price change, I do not put the date and time of the transaction, only %.
Blue zones - activation zones.
Green zones - take zones.
The red zone - stop zone.
Working out the stop when the price returns to the level after activation + fixing in the red zone.
Orange arrow - the direction of take.
Blue arrow - neutral scenario without activating the trade.
The red arrow - the direction of the stop.
SUM PNL: This parameter displays the total % of all closed ideas of the "new" format (according to the author) for this sector at the time of publication of the idea. The calculation is very "clumsy" just the sum of the profits of all the ideas, based on this indicator, you can more accurately assess the risks when working with my ideas of this sector. I present you the construction of the idea, you can use it yourself as you like based on your subjective view and risks, the calculation of the PNL indicator is carried out only on transactions that the author closed on TV in manual mode or by take.
P.S Please use RM (risk management) and MM (money management) if you decide to use my ideas, there will always be unprofitable ideas, this will definitely happen, the goal of the system is that there will be more profitable ideas at a distance.


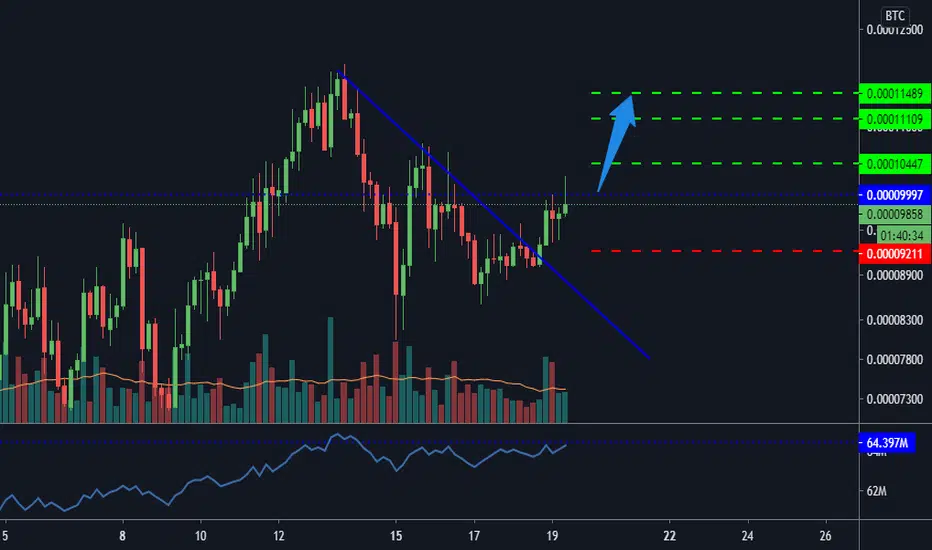
$KAVA, Looking strong as it pushes toward ~8700 sats$KAVA
Looking strong as it pushes toward ~8700 sats making a HH w/ increasing volume ..
UCTS bullish across multiple timeframes (1D/2D)
If manages to cross over // flips into support, then looking for ~11k/ 14k sats
#KAVA


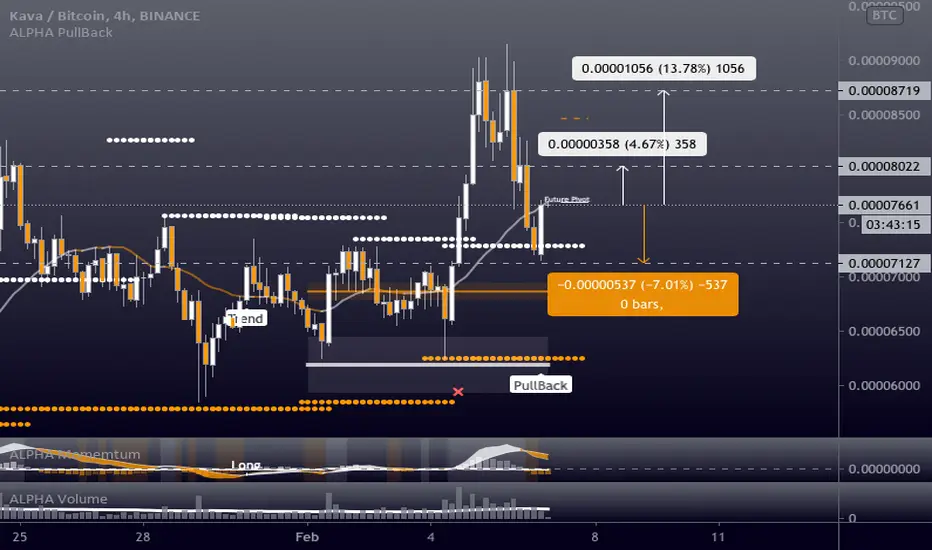
KAVABTC - Potential - Long 13.78%KAVABTC - Potential - Long 13.78%
Entry- 7664
TP1- 8022
TP2- 8719
SL- 7127
- Trigger - Pullback
- BTC - Dom & Price falling - Alts stabilising
- RR 1.9
- Trailing Buy - 1%
- Trailing Profit - 1%
- Trailing Stop-Loss - no

KAVABtc...beautiful ascending triangleKava looks to be setting up for a breakout. Two ways to play it...
1) try to enter now keeping a stop under the support line that can be seen under the angle of the triangle (risky play as this could just start channeling although i dont think so
2) Wait until it breaks out of the pattern and get in on the retest of the resistance now turned support. Stop would be under a buy zone beneath the broken level and should be fairly tight. This is the safer way to play this pattern.

Kava KAVABTC - Elliott Wave + Channel (NEW BULL MARKET)- Kava is moving in Elliott Waves. Now i am expecting at least a retracement to 0.5 fib.
- On the monthly chart we can see a broadening wedge that can serve as a resistance or support in the future.
- RSI made a significant new high - the trend changed from bearish to bullish
- Impulse Elliott Wave is clearly completed on the main broadening wedge support
- Expected duration of the trade, Stop Loss, Profit Target, Entry Price and Risk To Reward Ratio - for more information, please check my signature down below ↓

KAVA.BTC (Y21.P1.E1).Interests me.StalkingHi All,
Currently this structure interests me and the indicators show some bottoming sign.
I would like to see a reversal pattern in the lower time frames at this level, followed by the 1 hrly 13/50 ema cross and\or bullish candle combinations.
That's it for now as its about keeping alert for opportunities.
All the best,
S.SAri
Let see if there is any reversal pattern in the lower time frames
Let see if any wicks are formed on the 4 HRLY

Crypto|KAVA/BTC|LongLong KAVA/BTC
Activation of the transaction only when the blue zone is fixed/broken.
The idea is to work out the resistance level .
* Possible closing of a trade before reaching the take/stop zone. The author can close the deal for subjective reasons, this does not completely cancel the idea and is not a call to the same action, you can continue working out the idea according to your data, but without the support of the author.
+ Maybe right now we will go even lower, then it's okay, the idea is not activated and simply canceled.
The "forecast" tool is used for more noticeable display of % (for the place of the usual % scale) of the price change, I do not put the date and time of the transaction, only %.
Blue zones - activation zones.
Green zones - take zones.
The red zone - stop zone.
Working out the stop when the price returns to the level after activation + fixing in the red zone.
Orange arrow - the direction of take.
Blue arrow - neutral scenario without activating the trade.
The red arrow - the direction of the stop.
SUM PNL: This parameter displays the total % of all closed ideas of the "new" format (according to the author) for this sector at the time of publication of the idea. The calculation is very "clumsy" just the sum of the profits of all the ideas, based on this indicator, you can more accurately assess the risks when working with my ideas of this sector. I present you the construction of the idea, you can use it yourself as you like based on your subjective view and risks, the calculation of the PNL indicator is carried out only on transactions that the author closed on TV in manual mode or by take.
P.S Please use RM (risk management) and MM (money management) if you decide to use my ideas, there will always be unprofitable ideas, this will definitely happen, the goal of the system is that there will be more profitable ideas at a distance.

Crypto|KAVA/BTC|LongLong KAVA/BTC
Activation of the transaction only when the blue zone is fixed/broken.
The idea is to work out a large level of trend resistance of a triangle (Equilateral).
* Possible closing of a trade before reaching the take/stop zone.
+ Maybe right now we will go even lower, then it's okay, the idea is not activated and simply canceled.
The "forecast" tool is used for more noticeable display of % (for the place of the usual % scale) of the price change, I do not put the date and time of the transaction, only %.
Blue zones - activation zones.
Green zones - take zones.
The red zone - the stop zone.
Working out the stop when the price returns to the level after activation + fixing in the red zone.
Orange arrow - the direction of take.
Blue arrow - neutral scenario without activating the trade.
The red arrow - the direction of the stop.

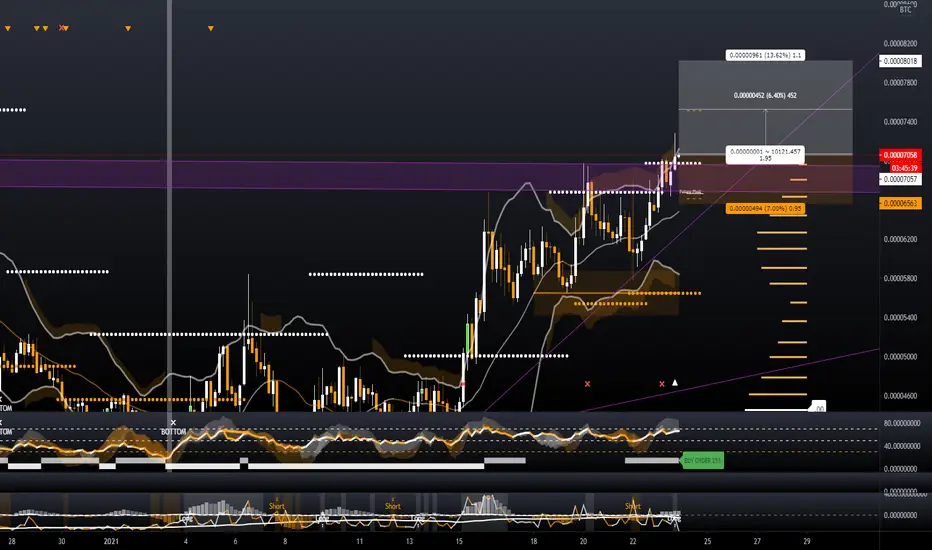
#KAVA/BTC - Potential 13.62% #SWING
#LONG
#KAVA/BTC - Potential 13.62%
Entry- 7057
TP1- 7526 (75%)
TP2- 8018 (25%)
SL- 6563
- Key Notes - BTC looking Bearish - Weekend Trading = Higher Risk
- RR - 1.95
- Trailing Buy - 0.5%
- Trailing Profit - 1%
- Trailing Stop-Loss - No


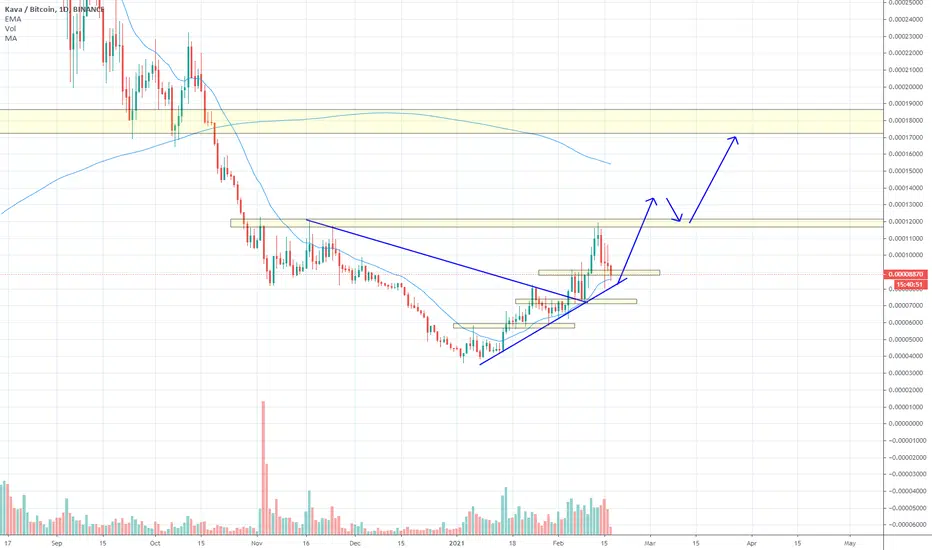
KavaKava trade setup if it breaks out of this descending channel. Right now at critical point. I believe it has seen its bottom.

KAVA Possible Trend UP!If BTC .D keep falling we can expect ATL / BTC pairs to uptrend.
Kava bullish indications:
👉Break out of trend resistance
👉Bullish EMA crossing

KAVABTC: Nice pattern forming for a shortThe pattern is completing so we expect the short very soon. I will keep this chart updated. Thank you for the support.

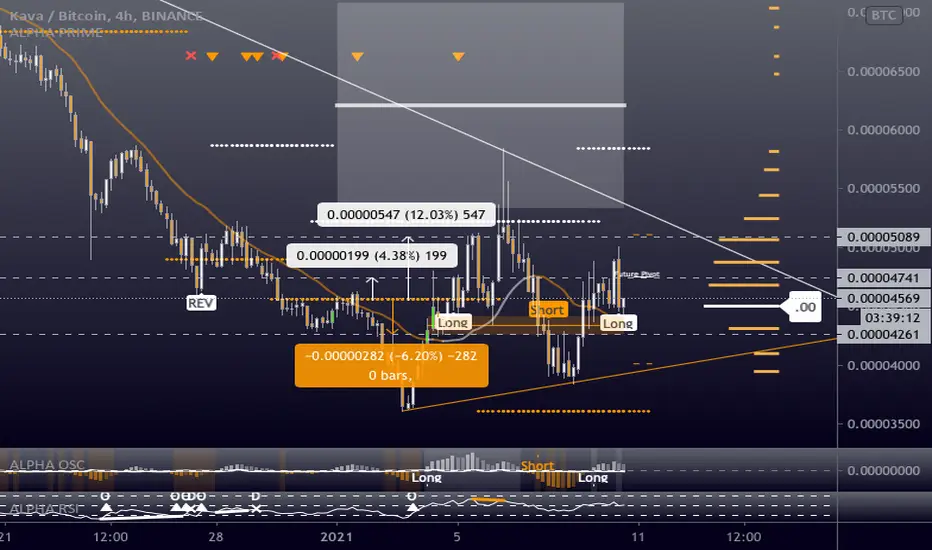
KAVABTC - Long - Potential 12.03%KAVABTC - Long - Potential 12.03%
Entry- 4543
TP1- 4741
TP2- 5089
SL- 4261
- BTC High Volatility - Caution
- RR - 1.94
- Trailing Buy - 0.5%
- Trailing Profit - 1%
- Trailing Stop-Loss - No