$KAVA MAINNET NO INFLATION, TOTAL TOKEN ONLY BURN DEC 7Th 2023Kava Mainnet is coming with no inflation feature meaning. With more than 3 years in the space developing and making market. KAVA is a good choice for this run. With less than 1B USD is a gem. This layer1 is in the RWA narrative. Prices are ranging since days in these levels.
The future is coming and is already here, KAVA is compromised to be part of the world tokenization. The project is running smoothly and it's calling investor attention due to the 15 mainnet that will be the next phase for KAVA being a deflationary token. There won't be any more $KAVA token in the future, instead the model economy will go to burn coins and take them out from the market.
This will create scarcity, and scarcity creates demand.
www.kava.io
If you liked this comment. Follow me 💓
KAVAUSDT.P trade ideas

KAVA target 1.54h time frame
-
KAVA is creating a potential long-term double bottom structure. Currently making a cup and handles pattern in lower time frame, this CH provide us a reasonable setting for SL. Also, if KAVA maintain the pumping momentum, there are three targets as below. Risk to reward is great, even only reach the first target.
-
TP: 1~1.05 / 1.17 / 1.5
SL: 0.725


KAVA/USDT Anticipating a Bullish Reversal? 👀 🚀KAVA 💎 Paradisers, focus on #KAVAUSDT as it shows promising signs of a bullish reversal. After encountering resistance in the supply zone, the asset is now poised for a potential upward continuation from its current demand zone.
💎 Reflecting on #KAVA recent performance, we've observed a decisive break above the $.708 supply level, leading to an upward trajectory. However, it faced resistance at a higher supply level. Current trends suggest a retest of the demand zone, which, if successful, could confirm a bullish double bottom pattern, indicating a strong potential for further bullish movement. KAVA is targeting supply levels at $.865, with the ambition to reach even higher at $1.057.
💎 Experienced traders know that such scenarios require nuanced timing and strategic entry points. It's vital to identify the most favorable moments for entering the market, while also avoiding the pitfalls of buying at the peak.
💎should KAVA break below the critical demand level of $.694, it may signal a significant bearish shift, necessitating a reassessment of the bullish outlook.
💎In this dynamic and evolving market, disciplined strategy and informed decision-making are key. Developing a robust trading strategy that incorporates effective money management and a deep understanding of support and resistance levels is crucial for achieving sustainable trading success. 🌴💰

KAVA buying zoneone of my favorite token is kava , the best buying zone in my opinion is the red zone indicated in the chart .
not a financial advice
thank you

KAVA buying zones (for investing not trading ) i see two buying zone for KAVA , they are indicated in the two support zones (10/10 support zone which is the lowest price for investing , and the second one which is 8/10 support zone )
Notice : as we are right now , 21-17k BTC range , every one can begin to accumulate their desirable tokens , for example 30% now and the rest when prices reached the area mentioned , because the market is a guessing game , no one know exactly what would happen . its okay to start DCA now , because we are already +80% down from almost all ALTS ATH . I want to point out , that the price could go even lower than the zone mentioned , however , as i mentioned before , from here every one can start DCA , no one could catch the real bottom unless he has a time travel machine .
not a financial advice , only for entertainment .
thank you

KAVA Bullish Surge: Your Golden Opportunity to Buy**Short Fundamental Analysis of Kava (KAVA)**
Kava is a decentralized finance (DeFi) platform built on the Cosmos blockchain that enables users to borrow, lend, and stablecoin mint. It aims to provide a more scalable and efficient alternative to existing DeFi platforms by leveraging the Cosmos SDK and Tendermint consensus mechanism.
**Recent News and Updates for Kava**
* **October 2023:** Kava releases Kava 11, a major upgrade that introduces several new features, including support for the Ethereum Virtual Machine (EVM) and the ability to stake KAVA tokens to earn rewards.
* **September 2023:** Kava Labs launches the Kava Rise program, a $70 million initiative to support the growth of the Kava ecosystem.
* **August 2023:** Kava integrates with Chainlink, a decentralized oracle network, to provide real-time price data for KAVA and other assets.
**Disclaimer**
Please note that this information is not intended as financial advice. It is important to do your own research before investing in any cryptocurrency.

KAVAKAVA must flip .91c then it will confirm my wave 3. Because the rest of the crypto markets are very bullish, their are many lagging 2021 coin and also 2017 coins. I think they will catch up soon.

#KAVA/USDT trying to reclaim the Diagonal Trendline#KAVA/USDT trying to reclaim the Diagonal Trendline and PWL $0.73 support level in 4-Hour TF!
$KAVA needs to reclaim the support to gain the bullish momentum. Wait for candle closing above it to long it.

KAVA/USDT Break and Bullish Momentum ??? KAVA Analysis Today 💎 KAVA has undoubtedly captured the market's attention. Presently, KAVA has broken out of the Descending channel and has entered a confirmed retesting phase. Observations indicate that after its retest on the resistance trendline of the channel, KAVA experienced a sharp upward trajectory, potentially aiming for the resistance zone.
💎 Should KAVA decisively surpass the notable resistance at $0.730 and sustain above it, there's a strong possibility for the coin to continue its bullish run, Probability targeting the supply zone and the bearish OB.
💎 However, if KAVA faces a setback at the resistance zone, it might retreat towards its proximate support to gather momentum. There's also a chance that KAVA could descend to the demand zone to build a more robust momentum for another attempt at breaking the resistance.
💎 if KAVA revisits the demand zone and fails to uphold its position, it could indicate a bearish trend. This would mean a potential downward spiral for KAVA, with the coin possibly gravitating towards its key support zone.


💡Trade Idea #KAVA/USDT:Still looking at the charts on Friday 24/. #KAVA looks like it is ready to go for another leg up, but it struggles to get through this 1D resistance level.

#KAVA/USDT - Long - Potential 89.95%In mid October just as BTC started getting its act together KAVA touched what appears to be its floor price support at 0.565. It hit this price last in Jan 2023 when post FTX the market was bottoming. Previously we've only been below this price for a few months in early 2020.
This support sits in the middle of a big order block which following the support touch has seen price bounce dramatically - not sure what your long term plan is but bouncing back from floor price support is a good sign to go long.
In terms of technicals we can draw in two distinct bullish falling wedge patterns, one from the big May price spike (dotted line - Mainnet launch?) and one from the tighter downtrend that started mid July (solid white line) either way we have a textbook breakout and have crossed the 20 and 50 moving averages - a move that usually triggers lots of automated buys and is probably contributing to the buy order block that occured around this price point.
The RSI though is what I'm most focussed on. On these longer timeframes RSI breakouts are very strong indictaors. The KAVA RSI breakout is near prefect. A 6 month downtrend from overbought to oversold with the break occuring exactly as we reversed from oversold and still to cross the halfway point to overbought indictaing plenty of remaining bullish momentum.
Drawbacks are - yet to cross the 200MA. We've tested it 3 times this year (March, May and June) and been rejected 3 times. Big sell orders seem to be active between 0.897 and 1.076, this resistance has capped growth all year and prevented KAVA running up like BTC. We'll need big volume to breakout here so we are likely dependant on the total market cap expanding for that (so basically despite its bullish chart we're still at the mercy of BTC - luckily BTC has the ETF's and Halving which should massively increase volumes and via the old 'ALT cycle' KAVA should catch some of that trickledown volume). Last one is a confirmation retrace from here is possible esp. if we see BTC correct short term. Big breakouts often run out of volume and need to dip back into the liquidity which pumped them initially. This often visually looks like price retracing to the top of the broken trendline (where hopefully buy orders remain) before pumping again. This is very possible here with BTC also likely to do the same and lead the market.
Lastly targets. As always I use a FIB and then adjust of rorder blocks so my first target would be 0.897 which lines up closely with the 0.382 fib (adjusted for the sell orders below it), 1.048 - the 0.5 fib at the top of the sell block (tbh if I was actually trading this I'd probably take profit next at 0.99 just because the of the psych $1 point), 1.166 the 0.618 fib level we can see is strong resistance at the start of this market cycle) and finally 1.336 the fib 0.786 just because!
If you are already in profit and just wat an exit you could also look at taking profit at the 200MA as mentioned this has been tough resistance all year.
If you need an ATH type move then hold with the bull run KAVA has a partnership with INJ which I'm very bullish on and tether so falls into the category of real project with actual utility - i.e potential to capitalise on a bullish market over the next 12-18 months.

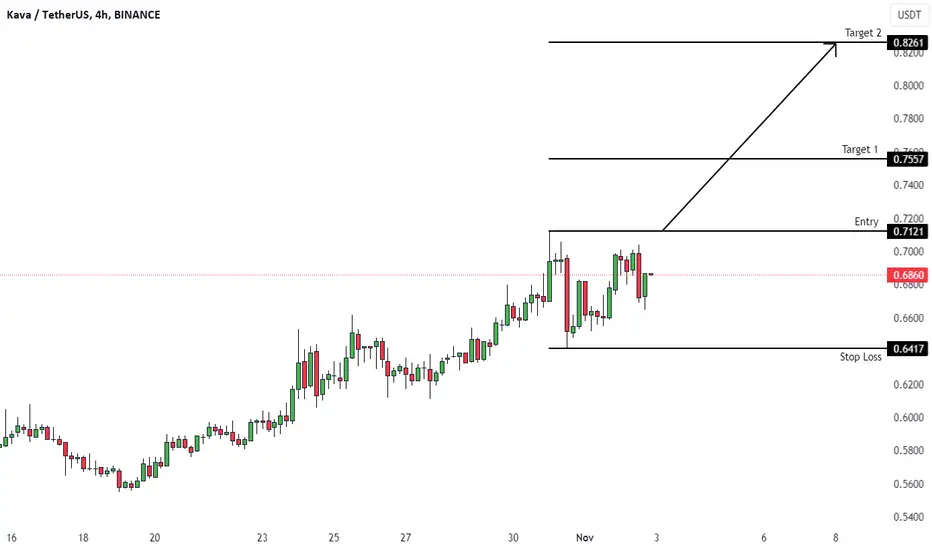
KAVAUSDT (4H) - Bullish breakoutHi Traders
KAVAUSDT (4H Timeframe)
The market is in an uptrend, and we are waiting for an entry signal to go LONG above the 0.7121 resistance level. Only the downward break of 0.6417 would cancel the bullish scenario.
Trade details
Entry: 0.7121
Stop loss: 0.6417
Take profit 1: 0.7557
Take profit 2: 0.8261
Score: 8
Strategy: Bullish breakout
KAVA Long OpportunityNot a lot to this trade, beside longs rotating toward KAVA probably by mid November to hit this target.
Good luck!

kava breaking multi year downtrend sems like preparing for massive recovery formed and breaking falling wedge in 3 days timeframe expecting successful breakout soon trend line is weak due to multiple tests
incase of successful breakout expecting massive recovery in coming days expecting move towards 2.50$ keep eyes on kava and try to catch some after breakout

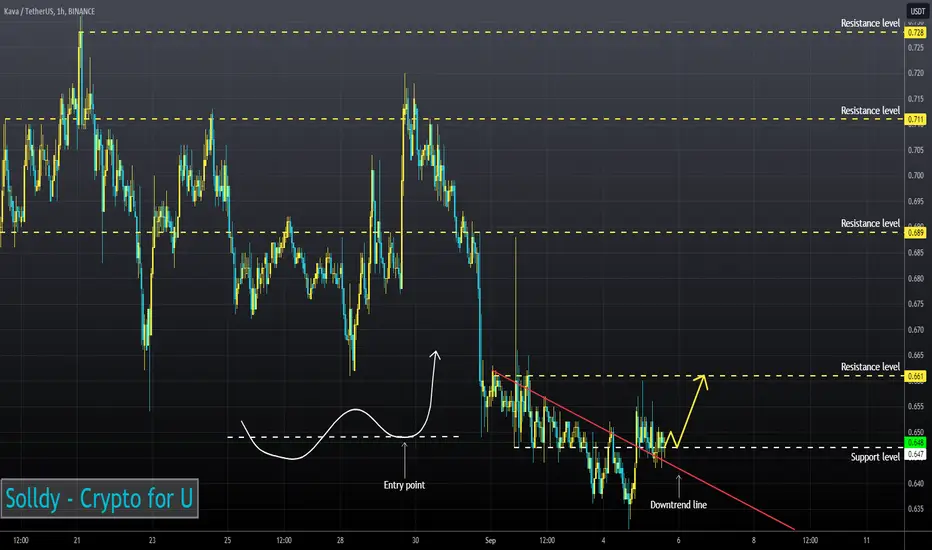
Keeping an eye on #KAVA/USDT Trendline in 1-Hour TF!Keeping an eye on #KAVA/USDT Trendline in 1-Hour TF!
$KAVA holding the PWH $0.607 support really well, and I am expecting some more upwards momentum.
The local resistance level is PDH $0.6485. I am expecting a scenario like this.

KAVA/USDT 4HKAVA forms a falling wedge pattern. After a retest of our top resistance, we should hit the first target soon.

Kavausdt Hi everybody
I'm Mehrab
my trades based on Sam seiden /supply and demand /
in this asset
we see good pullback to our base that have 5 option *moveout-breakout and the other

KAVAUSDT-15M-TRENDREVERSALKAVAUSDT will possibly reverse the trend in a 15m time frame because it is making some diversion on rsi and it has a bullish order block near daily resistance
KAVA/USDT 1 Day long position setupBINANCE:KAVAUSDT - 1-day long position setup
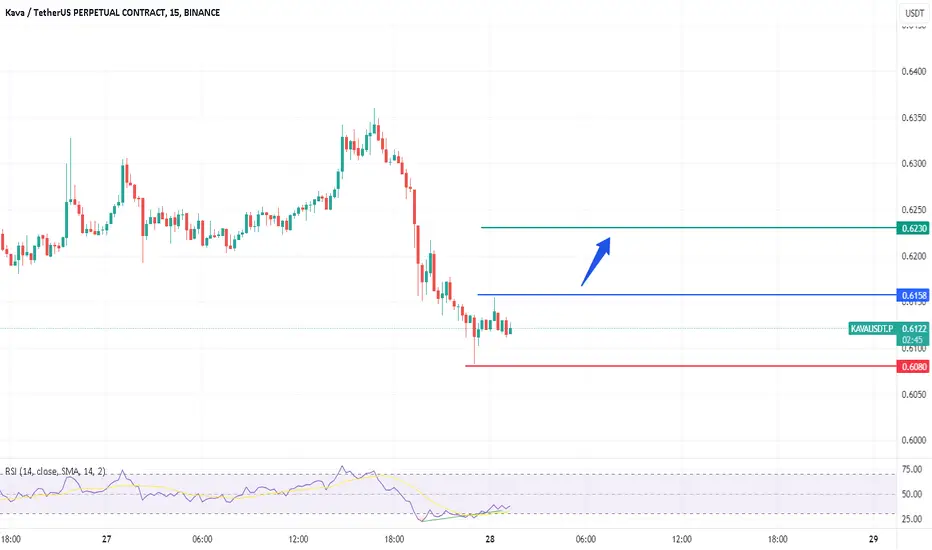
KAVA Failing Wedge showing good Reversal at this point .6100 to .6300 Level.
Bullish divergence is suggesting that upward movement is likely in the coming days
Overall, this is a bullish setup for KAVA/USDT, and a long position could be considered.
Please note that this is not financial advice, and you should always do your own research before making any investment decisions.

Try good long. RR 1/10 KAVAI expect a good upward movement after the weekend. We will also get a good entry point for the spot in the long term.

KAVAUSD ❕ broke up the downtrend lineKAVA has fixed above 50EMA on the 1H TF.
RSI indicates that the initiative is shifting to the bulls.
I believe that the asset will grow after fixing above the support.