KAVA LONGLet's try to take advantage of BTC's upward momentum to open some longs in altcoins, CRYPTOCAP:KAVA has hit its lower OB which as we can see with 25% is a good OB that could work as a support zone.
KAVAUSDT trade ideas

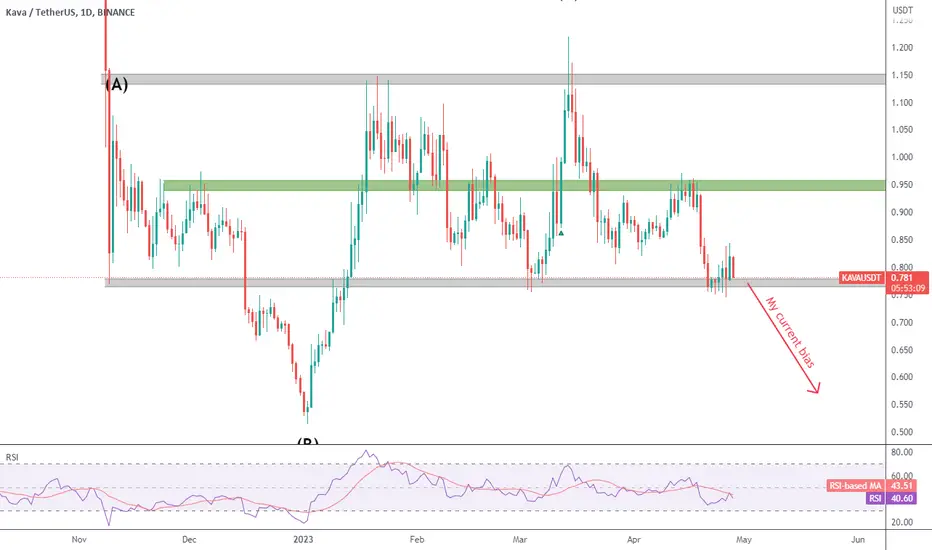
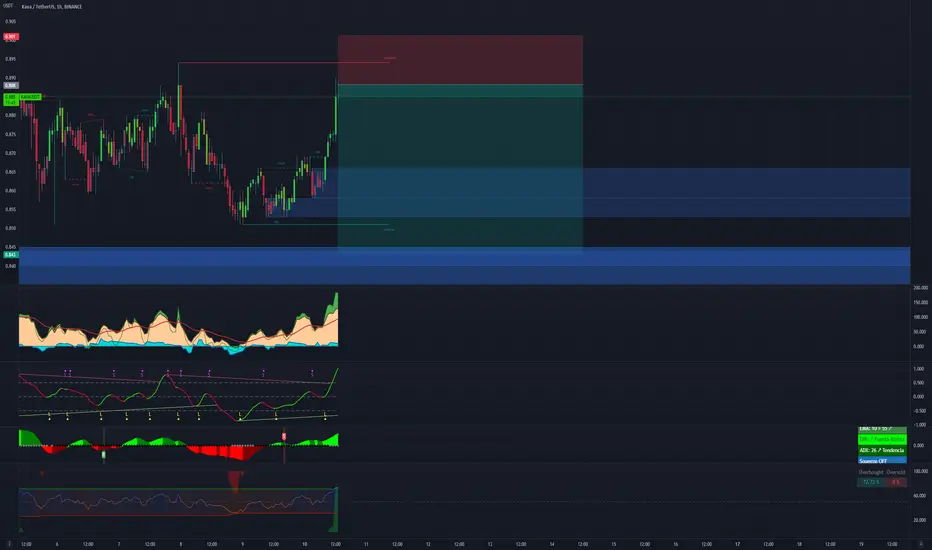
KAVA - Biased to the downside
I now have a primary bearish count for KAVA, since price action is compatible with an expanded flat (black ABC).
We have 2 major channel boundaries (gray zones), and a mid-channel resistance (green zone).
A break of the channel support could lead us to new lower lows. Just be mindful of false breaks (I´d wait for a break / retest before shorting).
KAVAUSDT last chance before "sell in May & run away)?Full stoch reset.
ROC >-5
UO implies for a rally
3 consecutive dowdays and seems selling pressure fading.
plus participation implies we must have final rally before mid of May.
so I go long at Monday. it may run very high, till 3 usd or higher.

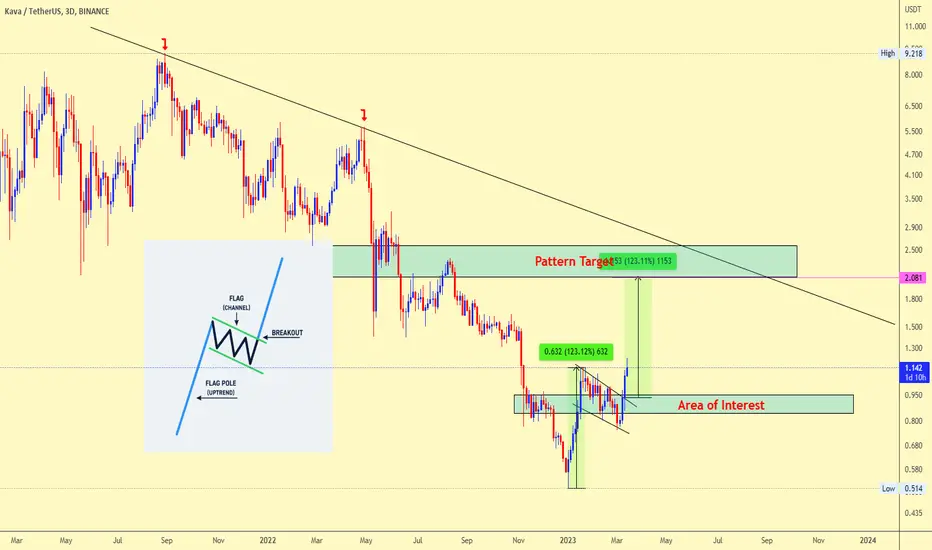
KAVAUSDT Breakout AlertHello, crypto enthusiasts! Today we have an exciting update on the KAVAUSDT trading pair, as technical analysis indicates a potential breakout from a bullish flag and pole structure. This pattern suggests that KAVAUSDT may be on the verge of a significant move upwards, with a price target of $2.081. Let's dive into the details.
Technically speaking, KAVAUSDT chart shows the formation of a bullish flag and pole structure, a pattern that often indicates a potential upward trend continuation. The "pole" is characterized by a strong, sharp price increase, while the "flag" is a brief consolidation period marked by a downward sloping parallel channel.
In the case of KAVAUSDT, the price has been trading within this flag pattern for some time, signaling that the market is gathering momentum for the next move. The breakout from the bullish flag could lead to a continuation of the upward trend, which brings us to the target price of $2.081.
Major area to watch is the AREA of Interest shown on the chart. As always, it's crucial to use proper risk management strategies and monitor the key support and resistance levels. Keep a close eye on the KAVAUSDT chart in the coming days, and happy trading!
Enjoy.
KAVA - ready to drink this CAVAthere are two possible entry points and a very tight stop loss below entry 2.
looks all set to rock n roll.
lets see if it rolls...

KAVA upside potentialthis is my kava trade, dont recommend to trade it.
if you will open a small position size because of the current market conditions.
the overall market is overheated.

$KAVA #kunhothotKAVA 1.3-1.4 is possible the confluence resistance zone
1. Bat Pattern
2. 61.8AB=161.8CD
3. POI
4. VWAP Band a and b area


Potential fill on KAVA Imbalance and Bullish OrderblockI see a potential fill to a Fair Value Gap and a Bullish Order for KAVA
Risk 2% on this trade:
This is an example of a continuation setup of my MATIC play from yesterday!

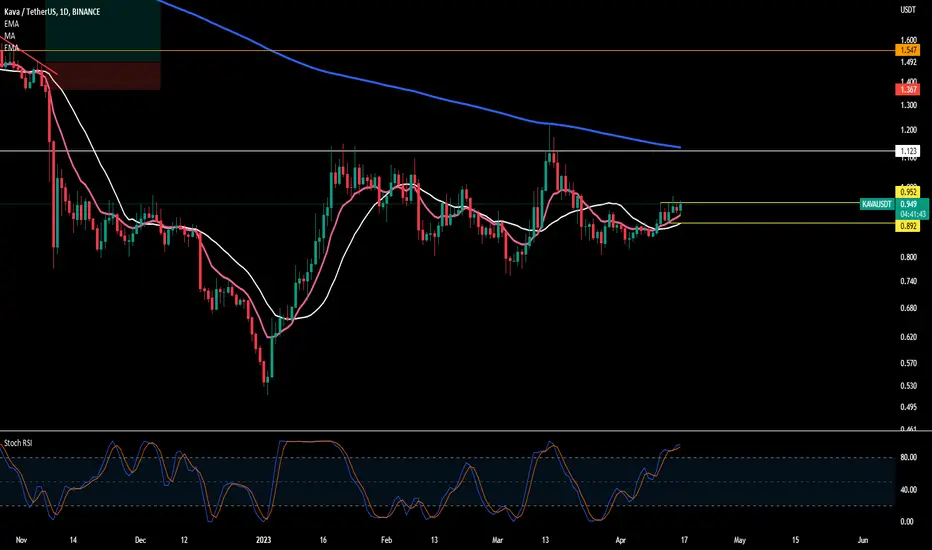
$KAVAwas looking for AVA saw this
about to break bad recon we see the orange line pretty quick
for now close above 200 ema pump a little come back test it then full send ..
not in this ...but buy above 952 with a stop wee below it
KAVA LONG TERM BULLISH REVERSAL Hello Traders and everyone, I am Hadi Karaali, Known as SNIPERS_FX
If you like the idea, do not forget to support with a like and follow.
KAVA WHAT'S NEXT! From a long-term perspective.
As we clearly see price is still overall bearish making clean lower lows and lower highs
Trading inside this falling channel.
And for the bulls to kick in from a long-term perspective we need a break above the marked major swing high
Until that price is still overall bearish, and we can be looking for new longs from a short-term perspective since price is around a strong support zone.
If you like this kind of analysis don't forget to like and follow
and as usual follow your trading plan and manage your risk.
Be patient and good luck!

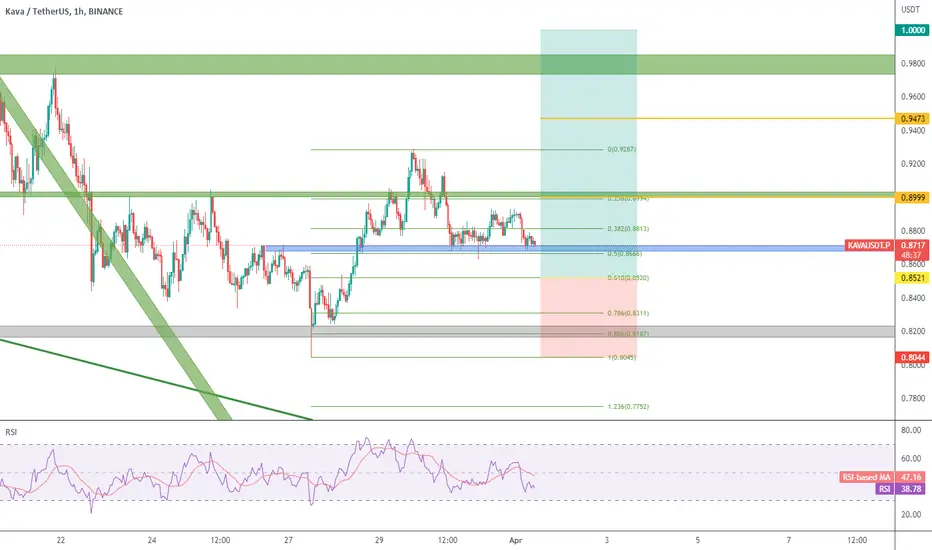
KAVA - Long TradeExpecting a swing to the upside
Limit Entry @ 0.8521
SL 0.8044
TP1 0.8999
TP2 0.9473
TP3 1.000
going downDO NOT FORGET USING A STOP LOSS
Warning:
This is just a suggestion and we do not guarantee profits. We advise you analyze the chart before opening any position.
I hope you are always profitable

KavaUsdt presurre for pulback.The price already break the trend line the price will pulback to the pointed levels a great chance for buyers . Enjoy tradi g

KAVA SHORTfollowing the bitcoin narrative, I expect a strong correction in kava.
following the bitcoin narrative, I expect a strong correction in kava.
On buying
and close to an order block
#KAVAUSDT.P#LQR #TOBTC #LaqiraProtocol The support and resistance are specified in the chart,
after confirmation you can open a trade,
he Levels have been obtained from the confluence of fibo and static levels,
this analysis is not an offer to buy or sell.

KAVAUSDT is testing the key levelOn the daily timeframe, the price is currently testing a key level at 0.833, where it has previously found clear support. Meanwhile, on the 4-hour timeframe, the price is forming a pennant pattern.
A pennant is a bullish continuation pattern characterized by a converging trendline that forms a small symmetrical triangle shape. This indicates that the market is taking a breather and could continue the uptrend after a potential breakout. If the price breaks out above the upper trendline of the pennant, this could signal a potential long position according to Plancton's Rules.
However, if the price fails to hold the key support level at 0.833, this could potentially trigger a short position based on Plancton's Rules.
–––––
Follow the Shrimp 🦐
Keep in mind.
🟣 Purple structure -> Monthly structure.
🔴 Red structure -> Weekly structure.
🔵 Blue structure -> Daily structure.
🟡 Yellow structure -> 4h structure.
⚫️ Black structure -> <= 1h structure.
Follow the Shrimp 🦐


Kava shortKava broke trough the ascending trendline. Asset broke trough the support level. Bearish movement to support level at 0.825 is possible.

KAVA 4h Pamp?Possible triangle scenario
Possbile target cab be seen on the chart
Goods:
+ 4h Resistance break out
+ New volumes
+ New support at 0.9

#KAVAUSDT #LQR #TOBTC #LaqiraProtocol Important support and resistance in the chart are specified
if confirm you can open a trade,
this analysis is not an offer to buy or sell.


SHORT KAVAHi everyone, Please hit the like button or leave a comment if this can make you some money.
ENTRY - TAKE PROFIT & STOP LOSS ON CHART.
