KAVAUSDT trade ideas

Nearly support zone, good point for buyingBINANCE:KAVAUSDT will move to support zone, reject and pullback to 0.93
Wait and see

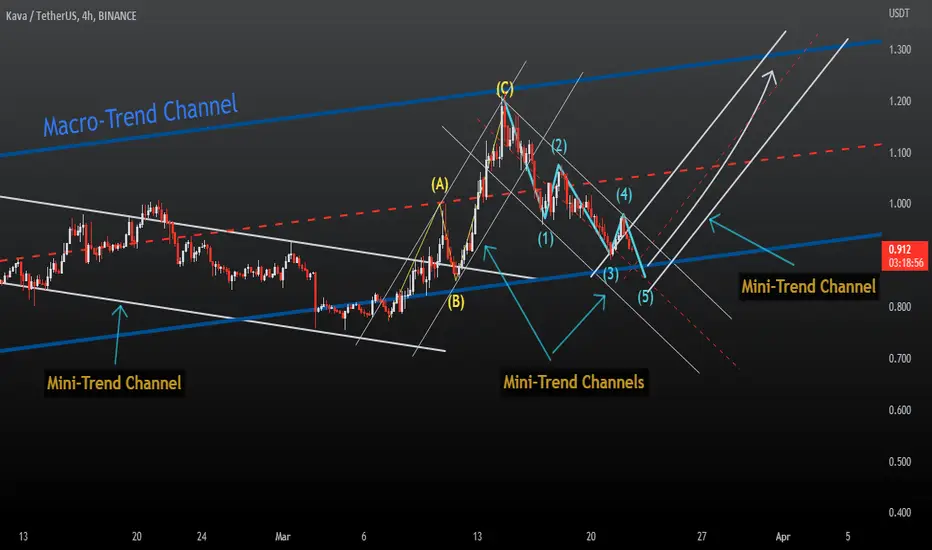
Trend Channels, One of the best trading strategy 🤓The channel is a powerful chart pattern for trading. Channels combines several forms of technical analysis to provide traders with entry and exiting points as well as risk control.
In this training, I will explain one of the simplest trading strategies called " Trend channel trading strategy ".
Please note, this post is a summary of this strategy and I only mention its main points.
😏
Types of channels and best for this strategy
A channel consists of at least four contact points because we need at least two low points to connect to each other and two high points to connect to each other. In general, there are three types:
Channels that are angled up are called ascending channels.
Channels that are angled down are descending channels.
Channels in which the trendlines are horizontal are called horizontal channels, range channels, trading ranges, rectangle channels.
The channels are also divided into three categories according to the time periods who make the price range :
Macro channels , which are made with 12-Hour time frame, daily time frame and above.
Mini channels , which are made with a time frame from 1-Hour to a maximum of 12-Hour.
Micro channels , which are made with time frames of less than 1-Hour.
**Tips:
1- Macro channels are made of Mini channels, and Mini channels are made of Micro channels, However, it is only an estimate and may not always be accurate, and they are Not the main rules and condition for Identifying channels or drawing them.
2- There is no special formula or law for naming the channels according to their time frames with these names (Macro, Mini and Micro) and you can use any time period for any type of channel.
Trade Reliability
Conformations represent the number of times the price has hits the channels trend lines and rebounded from the top or bottom of the channel. These are the important confirmation levels to remember:
1-2: Weak channel (not tradeable)
3-4: Adequate channel (tradeable)
5-6: Strong channel (reliable)
6+: Very strong channel (more reliable)
**these numbers are just for each one of trend line (up line or down line of channel).
I will write the continuation of this tutorial in the comments of this post. 😎

KAVA : LONG VIEWThe market overview its in the breakdown.
Kava still shows a volume view for an uptrend.
The only + volume at this moment.
KAVAUSDT Long.BINANCE:KAVAUSDT is making falling wedge, We will do long from here.
NO FINANCIAL ADVICE– The Information on this website, Crypto Current, is provided for educational, informational, and entertainment purposes only, without any express or implied warranty of any kind, including warranties of accuracy, completeness, or fitness for any particular purpose.


KAVABy stabilizing the high price of the daily resistance and by forming a triangle pattern, this position can have a good profit in the long direction

Kava/Usdt Trading IdeaHello, traders
I monitor the kava cryptocurrency for a short-term buying opportunity. If I get confirmation from the order block, I execute my trade
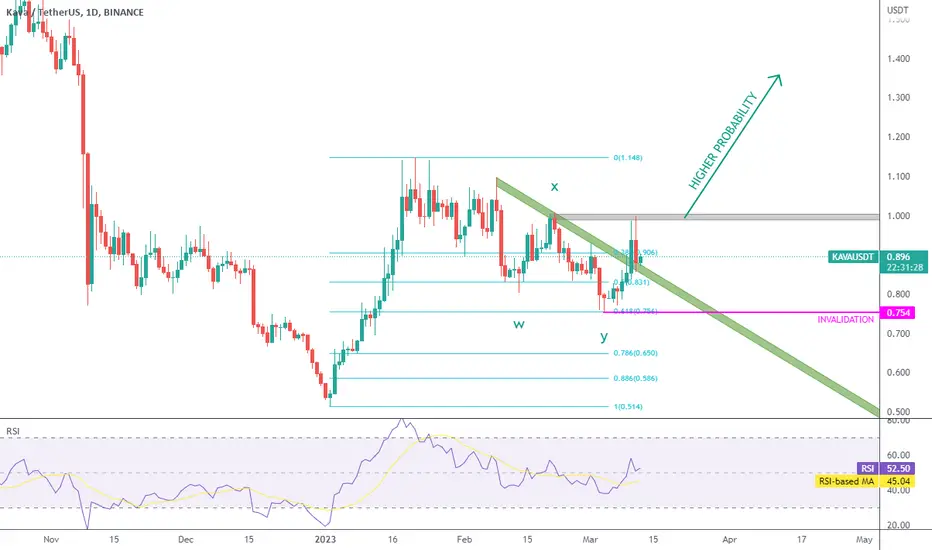
KAVA longA correction to major bullish trend stopped around Fibonacci 0.5 level. A continuation of ascending trend to 1 Fibonacci level is expected to happen.

KAVAUSDTPERP LONGLonging this coin to the moon! Bounced on my point of interest.
Entry:
.9673
TP Targets:
1.1185
1.3767
1.6349
2.4095
SL:
.9278
Manage your risk! USE LOW LEV ONLY! :)
HAPPY TRADING! #TYOR #DYOR

Kava. io formed bullish BAT for upto 17.50% moveHi dear friends, hope you are well and welcome to the new trade setup of Kava. io (KAVA) token with US Dollar pair.
Previously we caught a nice trade of KAVA as below:
Now on a 2-hr time frame, KAVA has formed a bullish BAT move for another price reversal.
Note: Above idea is for educational purpose only. It is advised to diversify and strictly follow the stop loss, and don't get stuck with trade


KAVAUSDT is inside the BullFlagKAVAUSDT has tested the demand zone at the 0.8$ area, indicating that there was significant buying pressure from traders at this level. Since then, the price has been moving upwards and is currently testing the upper dynamic resistance level within a bull flag pattern.
The bull flag pattern is a bullish continuation pattern that forms when there is a strong uptrend followed by a consolidation period in the form of a downward sloping flag. This pattern typically indicates that there is still strong buying pressure in the market, and traders are taking a brief pause before continuing to push the price upwards.
As per Plancton’s Rules, a breakout from the upper dynamic resistance level within the bull flag pattern could be an indication of a new long position. This means that if the price of KAVAUSDT breaks above the upper dynamic resistance level within the bull flag pattern, it could be a good opportunity to buy and hold KAVA with the expectation that the price will continue to rise.
–––––
Follow the Shrimp 🦐
Keep in mind.
🟣 Purple structure -> Monthly structure.
🔴 Red structure -> Weekly structure.
🔵 Blue structure -> Daily structure.
🟡 Yellow structure -> 4h structure.
⚫️ Black structure -> <= 1h structure.
Follow the Shrimp 🦐

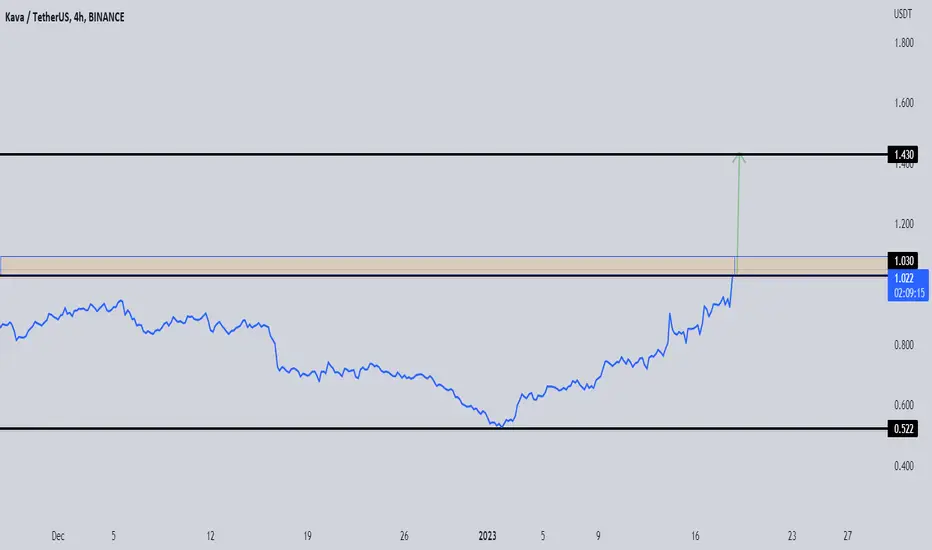
KAVA: Resistance Breakout!Kava (KAVA) technical analysis:
Trade setup : Price has broken above $1.00 resistance area and 200-day moving average to resume Uptrend. Upside potential to $1.40+ Momentum turned bullish again (MACD crossover). Our own proprietary research report published on 24th August highlighted several upcoming catalysts that could dramatically increase TVL (Total Value Locked) on this leading DeFi lending platform and potentially drive up the token price.
Trend : Uptrend on Short-Term basis, Neutral on Medium-Term basis and Downtrend on Long-Term basis.
Momentum is Bullish (MACD Line is above MACD Signal Line and RSI is above 55).
Support and Resistance : Nearest Support Zone is $0.80 (previous resistance), then $0.50. The nearest Resistance Zone is $1.00, which it broke, then $1.40.

#KAVA, Is it ahead of the curve or wrong?#KAVA
Is it ahead of the curve or wrong?
UCTS 2D Buy in place already
⏳🧘♂️

KAVA - Looking better than most alts
Kava is also going through a correction like everything in cryptoland, but its reaction is looking better that most alts.
$1 is still holding price down, but the break of the green descending trendline gives me the expectation that we will get a breakout.
KAVAUSDTHey traders, here is the analysi.
If you guys like my analysis please hit like👍 and follow.
Thanks.
DISCLAIMER- This is not financial advice.
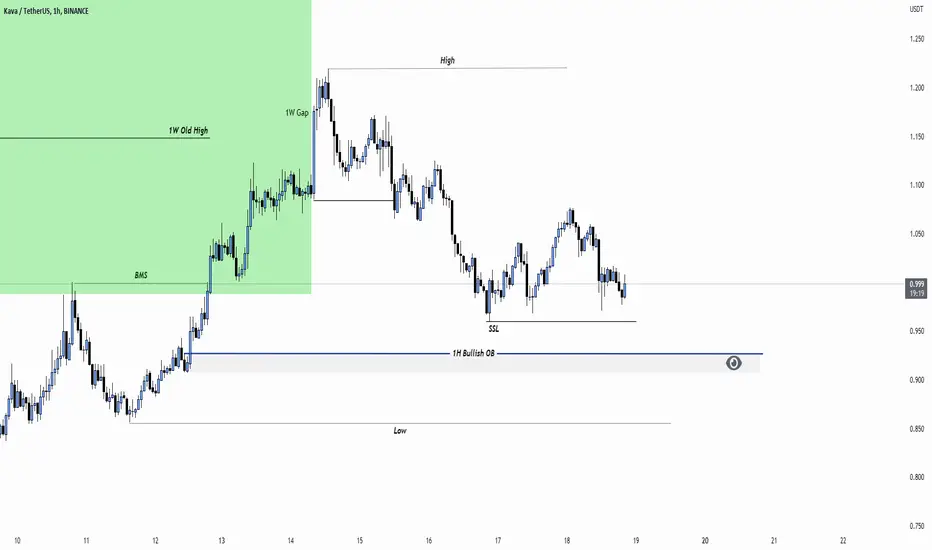
SMART MONEY CONCEPT

Kava short positionIn a strong bear market day, KAVA goes long without any fandumental news. As you see it is in strong resistance point in its chanel. In my oponion this is best position for SHORT.
First R/A ---> 0.836
2nd R/A ---> 0.771
GOOD LUCK

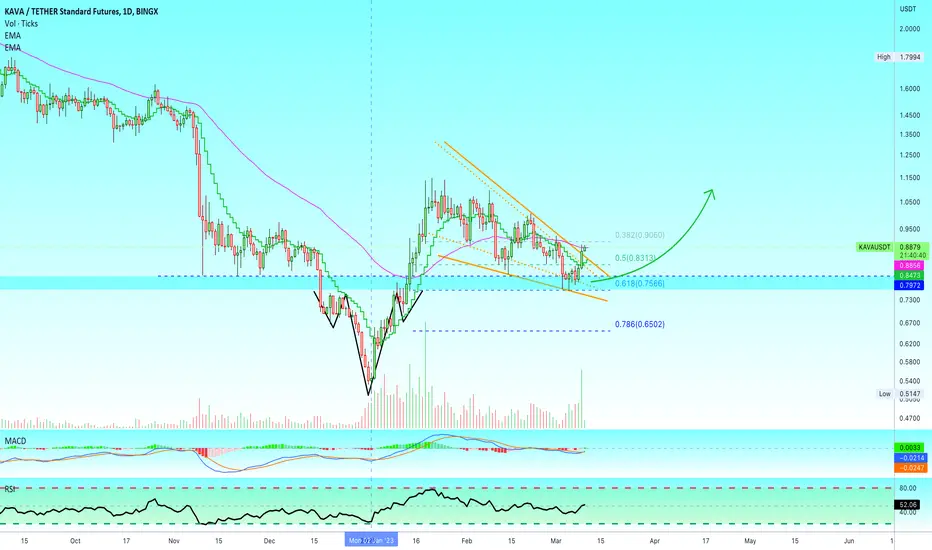
✴️ Kava Goes First Correction End Confirmed? Marketwide AnalysisKAVAUSDT hit a low in early January, like most of the Cryptocurrency market.
Many pairs hit their low in late December, just a few days before January which technically counts as the same.
From this low we get a strong bullish wave, January 2023, this is also true for most of the Cryptocurrency market.
After this wave we get a correction and here the correction hit bottom 3-5 March. This is also a theme that is repeating across the market.
Now, the important part.
KAVAUSDT is recovering, correction ends.
This is confirmed as its price moves above the moving averages including EMA50 and the really high volume yesterday.
If KAVA dropped with the rest of the market, recovered with the rest of the market and went into a correction together with the rest of the market, it will also produce the next leg up with the rest of the market.
That's the conclusion.
KAVAUSDT is already going bullish, moving first compared to the pairs that everybody is already looking at.
This is normal, the market movers will move first those that are least active/bought.
While everybody is always looking at Bitcoin, Shiba Inu, Cardano and the rest. If Bitcoin starts growing it would reveal that the correction is over and everybody would rush to buy and that's not something that is appealing to the whales.
And thus they move the least popular ones first... But what one does the rest follows.
If KAVAUSDT recovers, we know what the rest of the market will experience as well. This includes Bitcoin which looks shaky right now... Patience and a plan would remove all doubt while you wait.
Namaste.
Go KAVA! 1.14 and Beyond!We can see that KAVA broke the white trendline and 50 EMA Daily
This scenario may bting KAVA to 1.14 USD
My analysis will be invalid if KAVA dumps to below 0.737 USD

KAVA confirm bullishKAVAUSD reach to the base line according to price action principle and the reverse head and shoulder already formed the price is completely bullish in my opinion maybe you will see the price above 2 rupees

KAVA LOOKS BULLISHHi, dear traders. how are you ? Today we have a viewpoint to BUY/LONG the KAVA symbol.
For risk management, please don't forget stop loss and capital management
When we reach the first target, save some profit and then change the stop to entry
Comment if you have any questions
Thank You
