KAVAUSDT trade ideas

KAVA - Daily trendline breakdown is one of my favoritesReasons to take short
⭐️ BTC looks bearish
⭐️ Updating historical lows
⭐️ 5th touch
⭐️ Volume at top
⭐️ Level is visible on daily timeframe
⭐️ Level is 22 days old
⭐️ 40 ATR
Will enter when price squeezes to the leverl on 5m timeframe, the base will form and the strip will get faster.
If you don't understand the previous sentence, just use swing stop-loss 3-5%
Fix profit by parts:
1% - 1/3
2% - 1/3, stoploss to breakeven
What's left, hold to the maximum
What do you think of this idea? What is your opinion? Share it in the comments📄🖌
If you like the idea, please give it a like. This is the best "Thank you!" for the author 😊
P.S. Always do your own analysis before a trade. Put a stop loss. Fix profit in parts. Withdraw profits in fiat and reward yourself and your loved ones

KAVA Daily-T Review>>>>>>>>>>>>Hello EveryOne
I Have Tried My Best to Bring the best Possible outcome in this Chart without unnesseccery explanation's.
According to a previous analysis,
KAVA success to pass the first TP and important resistance .
In the case of good market,
We can hope for passing next TP(resistance's) in KAVA.
This is not financial advise
PLZ DYOR
With hopping success>>>>>>>>>>>

Bitcoin Range Breakout Soon? Trade the range until it breaks!BYBIT:BTCUSD
BYBIT:BTCUSDT
Bitcoin has been consolidating in a range for 21 Days now.
There is a history of ranges forming on BTC and breaking out.
Is the pattern about to break out?
I evaluate the important levels to look out for, take a quick look at alts. (Hence the video title has KAVAUSDT in it )
2 Fibonacci Golden pocket reversal areas that I identify where price could reverse
My message is clear and simple:
Please be careful trading right now. Bitcoin is at a Tipping Point.
It could break up or down.
Heck, we could keep ranging for a few days, but whatever you do, make sure you protect your capital.
Not Financial Advice. DYOR. Papertrade before using real money.
If this analysis helped you, please consider giving it a thumbs up and following.
Trade Safely,
Shawn

KAVA Full of news 👍👍👍👍There is a lot of news about this currency code these days. On the other hand, the bitcoin decline process is coming to an end and this currency code can give good profits to its shareholders.
Your constant friend Manouchehr Azar from Iran

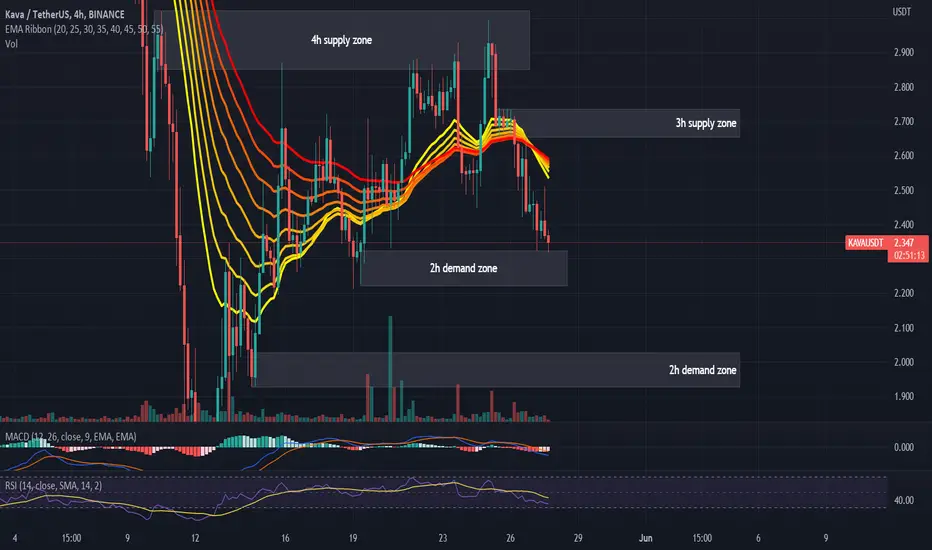
#KAVAUSDT 4H Chart
Price previously dropped and left a 3h supply zone around $2.65 and it is currently close to tapping into the 2h demand zone at $2.32. MACD is showing bearish weakness, RSI is sold and EMAs are turning bearish. This demand zone should be able to hold else we would expect price to fall towards the next major 2h demand zone around $2.
KAVAUSDT - SETUPKAVAUSDT price moved aggresively in previous hour as Bulls trying to break the falling trendline. But there is a resistance ahead, if aggressive volume come at resistance we could see an upward surge up to next resistance level. Keep Accumulating

Kava - Nice short opportunityReasons to take short
⭐️ BTC is bearish
⭐️ Trend bearish
⭐️ Level is 7d old
⭐️ Level is visible on multiple timeframes
⭐️ In the end of formation
⭐️ Slowly squeezing to the level
⭐️ Volume at top
⭐️ 4th touch
⭐️ Under VWAP
Will enter when price squeezes to the level on lower timeframes, the base will form and the strip will get faster.
If you don't understand the previous sentence, just use swing stop-loss 3-5%
Fix profit by parts:
1% - 1/3
2% - 1/3, stoploss to breakeven
What's left, hold to the maximum
What do you think of this idea? What is your opinion? Share it in the comments📄🖌
If you like the idea, please give it a like. This is the best "Thank you!" for the author 😊
P.S. Always do your own analysis before a trade. Put a stop loss. Fix profit in parts. Withdraw profits in fiat and reward yourself and your loved ones

Sell kava Before that, there was a downward trend, but it could not keep the important lull from falling more

Short term prediction! KavaKava's Evm launch tomorrow. It is going to add some value to their L1 space. Possible 10%-50% gains.
possible resistance $3.4 range
possible target $4 -4.5
sell under $2.4
possible early good entry point $2.7-$3

Kava movement this is a principle : each asset have its own plan !
Kava is moving up in opposite direction of other asset if you want to know why you have to ask kava market makers .
i have the first target for 4.148 $ for this asset . and i think it will have ATH about 17 JUl 2023 .its soon for predicting the target but my estimate is about 14 $

KAVAUSDT LONG!KAVAUSDT , I entered into a long trade at 1.929 and now the trade is in profit, by placing a Stop-Loss at the 2.208 I have made trading Risk-Free with good profit and this is the good trade plan for trading !!


KAVA Daily-T Analyze>>>>>>>Hello EveryOne
I Have Tried My Best to Bring the best Possible outcome in this Chart.
By temporary sales pressure decreases,
We have a short-term trading opportunity setup.
This is not financial advise.
PLZ DYOR.
With hopping success>>>>>>>>>>>>>>

KAVA/USDTKAVA / USDT
Break your descending channel downwards and return to the pan.
If it fails to break its $ 2.85 resistance, we can expect the $ 1.85 range to fall.
If it manages to break its resistance to the $ 3.5 range, we can see an increase.

KAVA is slowly breaking outI'm not sure how if this can go up too much, after all the last two 4h candles and last 3 daily candles had a lowering volume, however that's a breakout. This might stop right here or touch the resistance up there.
My thought is that it's stopping right here and is about to retrace.
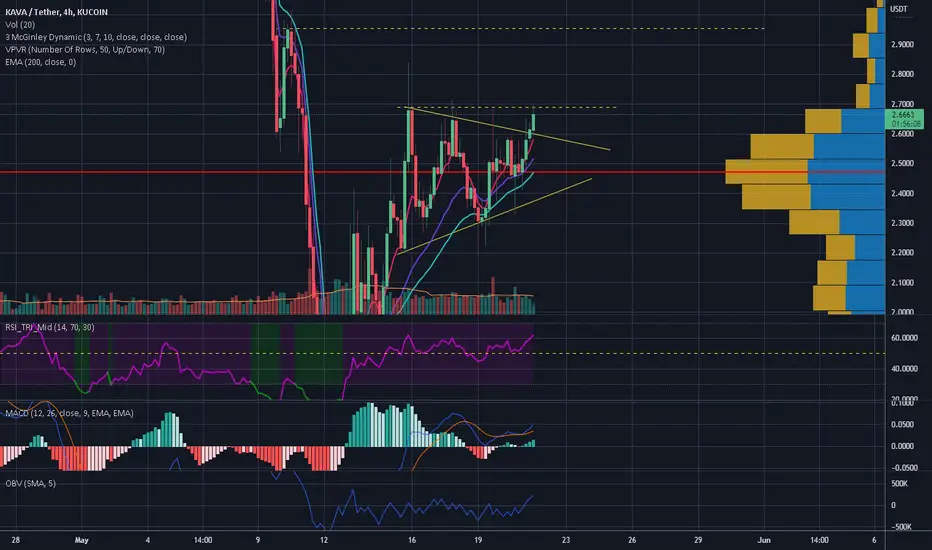
KAVA/USDT BUYING SETUPKAVA look's like make a ascending triangle we can setup entry after breakout or when retest to resistance become support , big buy volume on resistance at the time EMA 20 golden cross with EMA 50 so potential breakout
MACD showing bullish crossover
Buy zone : 2.65 - 2.5
Target : 2.786 - 2.966 - 3.282 - 3.503
Stop : 2.4

KAVAUSDTHello Crypto Lovers,
Mars Signals team wishes you high profits.
This is a one-day-time frame analysis for KAVAUSDT
The price has entered a descending channel and at the moment, it is fluctuating below the first resistance line. Here we must wait for a confirmation candle by which the price is able to move over the first resistance line. Then we will consider a long position for it. But if there is a weakness in the price trend and it cannot move above the first resistance line, we should have a short signal for the support line.
Warning: This is just a suggestion and we do not guarantee profits. We advise you analyze the chart before opening any position.
Wish you luck


kava usdt perp ==============
entry : market price or 2,7862 ( save entry area )
stop loss : 2,6992 (3%)
===============
take profit :
-2,9431
-3,0664
-3,1530
-3,2395
-3,3466
-3,5197

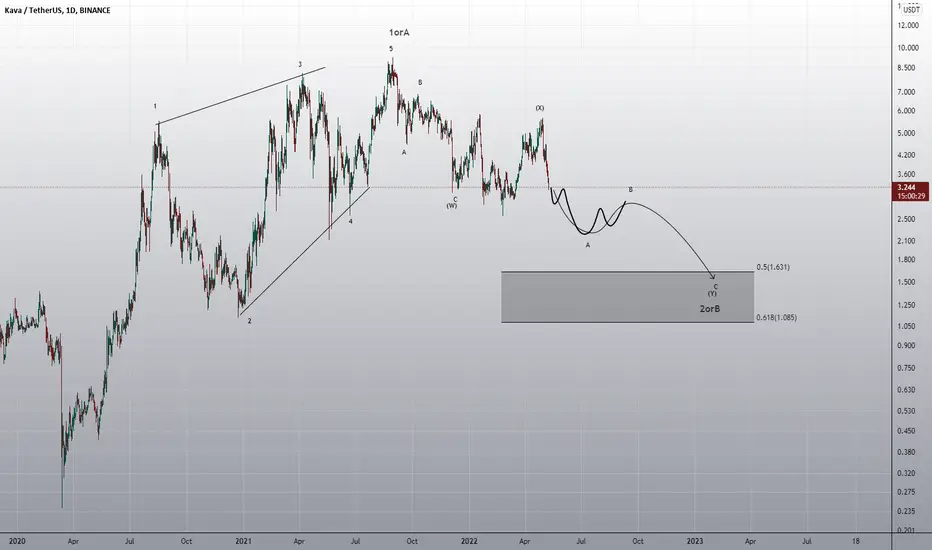
KAVAUSDTWave A of Y is completing. After completing the 2orB correction The wave, the price starts to rise.
KAVAUSDT Analysis (LOCAL VISION)Hello friends.
Please support my work by clicking the LIKE button👍(If you liked). Also i will appreciate for ur activity. Thank you!
Everything on the chart.
Entry: market and lower
Target: 4.9 and 5.9
after first target reached move ur stop to breakeven
Stop: ~2.9 (depending of ur risk). ALWAYS follow ur RM .
Risk/Reward: 1 to 3.5
risk is justified
Good luck everyone!
Follow me on TRADINGView, if you don't want to miss my next analysis or signals.
It's not financial advice.
Dont Forget, always make your own research before to trade my ideas!
Open to any questions and suggestions.

Kava/Tether 1DDue to the recent decline of Bitcoin, if the market is bullish, it is possible for the trend to return and achieve the desired profit.
