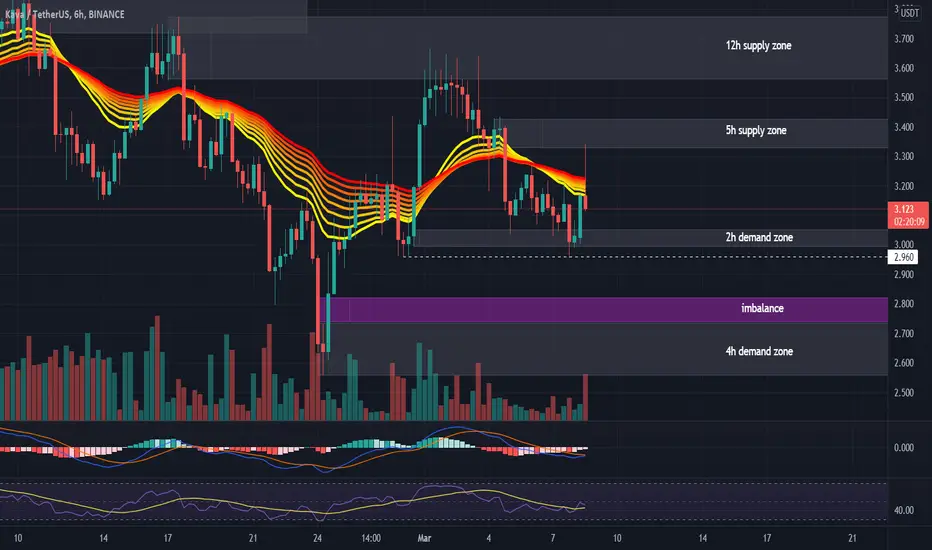
#KAVAUSDT 6H Chart
Price bounced from the 2h demand zone at $3 on the retest and is currently getting rejected from the 5h supply at $3.33 which it tested perfectly. MACD is showing bearish weakness, RSI and EMAs are neutral. I am expecting a retest of the 2h demand before moving up again and if broken then price would be diving down towards the 4h demand at $2.7 and bounce from there after filling the imbalance at $2.8.
KAVAUSDT trade ideas
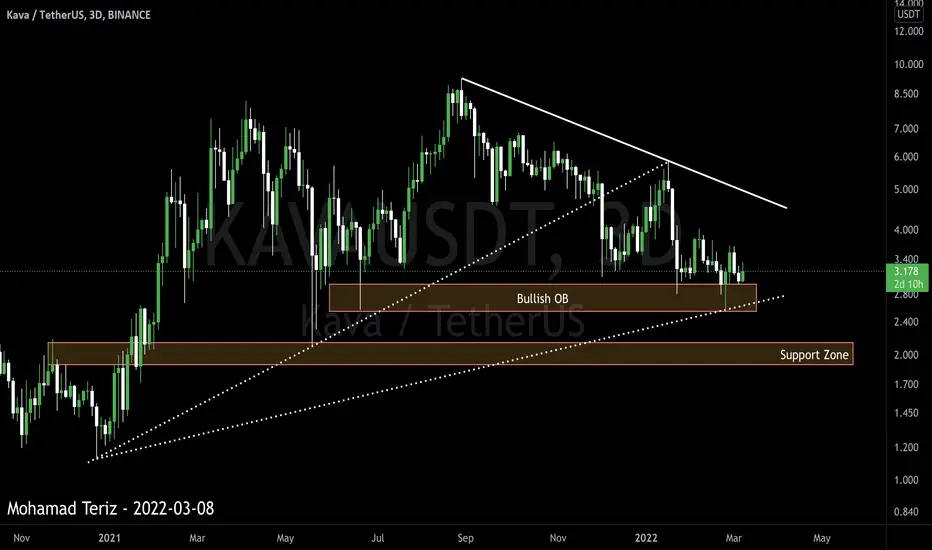
KAVAUSDT ON SUPPORTAs we can see in the chart, we will react in the OB range, and if the candle closes below this range, we will have a drop to the $ 2 support range. If we react to the OB range and the trend line, we will see the possibility of a price increase of up to $ 3.8 to $ 4.5.
Its not Buy or Sell SIGNAL
DYOR
BY : Mohamad Teriz - @AtonicShark
#KAVA lost $ 3.23 support.#KAVA lost $ 3.23 support.
Key Support $ 2.62 #KAVA is important.
#KAVA needs to maintain $ 2.62 support.

KAVA/USDT SCALP SETUP! 22% PROFIT EXPECTED FROM HERE!!Hello everyone, if you like the idea, do not forget to support with a like and follow.
Welcome to this KAVA/USDT Trade setup. KAVA looks bullish here.
Breaking out from the bull flag-like structure. Also, there is a 21ma support. So long now and add more in the dip.
Entry range:- $3.54-$3.6
Target1:- $3.82
Target2:- $3.98
Target3:- $4.16
Target4:- $4.36
SL:- $3.38
Lev:- 4x-6x
If you like this idea then do support it with like and follow.
Also, share your views in the comment section.
Thank You!

#KAVA is in the static resistance range of $ 3.23.#KAVA is in the static resistance range of $ 3.23.
#KAVA needs to break the downtrend line.
Support is in the $ 2.62 range.

KAVA charging to brake outKAVA are accumulating under resistant level, ready to brake out. EMA strong support on 1h, continuing trending. Heading to upper boundaries.

KAVAUSDT - Bullish Pattern!!KAVAUSDT (4h Chart) Technical analysis
Broadening Wedge Pattern
KAVAUSDT (4h Chart) Currently trading at $3.65
Buy level: Above $3.55
Stop loss: Below $3.35
TP1: $3.85
TP2: $4
TP3: $4.6
TP4 : $4.8
Max Leverage 3x
Always keep Stop loss
Follow Our Tradingview Account for More Technical Analysis Updates, | Like, Share and Comment Your thoughts.

#KAVA LONG X310 Target 🎯
as soon hit target 🎯 2 move the stop loss to the (Breakeven)
✔Remembering to realize profit on each target!
🏆Making profit never leaves traders poor

KAVA/USDT - 17% - LONGKAVA/USDT - 17% - LONG
Note: Breakout of triangle/long term trend line
Entry: 3.539
Target 1: 3.911
Target 2: 4.148
Stop-Loss: 3.138

KAVA ... one little bullish wave ?kava is on the bottom of asking area ...
we can long it with small SL
tp 1 can reach but u should save your profit and after the break the resistance area ... u can re-enter .

KAVA is ready for new highsKAVA is making a bullish flag well as a falling wedge. Chances are it will rally upward only if BTC does not dump from the current price.

kava.usdtMy feeling is that it is in a short-term uptrend and you can decide by considering the trend line. Take care of your capital.
This is just my idea.
Like if you like

KAVAUSDTThe next resistance point for KAVA seems to be 4.60 usd. The day's closing should be expected above 4 USD, which is the 50-day average. The target is around 5.5USD.

#Kava static resistance is strong#Kava is still Under Static powerfull Ressistance and trying to exit bulish channel.
but It seems #Kava needs some correction For a better Safe Uptrend.
Midd'line Dynamic Parallel Channel and static suppport zone is valuble.

KAVA : SCALPING Entry 3.50 something
it's retracement down for RSI correction
.
Everything is on the chart
Trade safe and fun
Prediction is prediction
could be right or wrong :P
feel free to comment n share ur idea

KAVAUSDT is testing the daily supportThe price had a huge rejection from the weekly resistance on the 0.5 Fibonacci (0.6$) level as you can see from the upper chart.
At the moment the price is creating a huge Engulfing candle on the weekly timeframe, it includes the previous 5 bars (5 weeks).
About the support, the price is testing daily static support and dynamic weekly support. As for Long Position, the logic is the same even for the short scenario. We avoid opening a new short position above the weekly structures.
How to approach?
we are waiting for the weekly close and we will understand if the price is going to create a double bottom of 3.7$.
If the price is going to have a breakout from the descending channel and retest the daily resistance (around 5$) as new support, we can add to our watchlist and wait for applying our rules.
Remember, It's not enough a breakout, we need a strategy.
–––––
Follow the Shrimp 🦐
Keep in mind.
🟣 Purple structure -> Monthly structure.
🔴 Red structure -> Weekly structure.
🔵 Blue structure -> Daily structure.
🟡 Yellow structure -> 4h structure.

KAVAUSDT ANALYSIS
⚡️⚡️ #KAVA/USDT ⚡️⚡️
Exchanges: Binance Futures
Signal Type: Regular (Long)
Leverage: Isolated (3.0X)
Amount: 2.0%
Entry Targets:
1) 3.443 - 50.0%
2) 3.412 - 50.0%
Take-Profit Targets:
1) 3.489 - 30.0%
2) 3.56 - 30.0%
3) 3.66 - 20.0%
4) 3.78 - 10.0%
5) 4.01 - 10.0%
Stop Targets:
1) 3.31 - 100.0%
Trailing Configuration:
Stop: Moving 2 Target -
Trigger: Target (2)
Published By: @Tbae_Nike

TRADE PLAN FOR KAVA FOR PROFITShello trader, another opportunity to trade KAVA for profits, from the chart we can see kava is on a strong support zone and the trade plan is shown on the chart be guided. next buy zone is specified.
tradehubng

KAVAUSDT Analysis (LOCAL VISION)Hello friends.
Please support my work by clicking the LIKE button👍(If you liked). Also i will appreciate for ur activity. Thank you!
Everything on the chart.
Nothing has changed from my last idea.
Entry: market and lower
Target: 5.5 and 6.5
after first target reached move ur stop to breakeven
Stop: ~3.3 (depending of ur risk). ALWAYS follow ur RM .
Risk/Reward: 1 to 3.5
risk is justified
Good luck everyone!
Follow me on TRADINGView, if you don't want to miss my next analysis or signals.
It's not financial advice.
Dont Forget, always make your own research before to trade my ideas!
Open to any questions and suggestions.

Kava bullish potential Kava dropped to 3.9 area which is also a strong support. Bullish divergence on daily timeframe

KAVAKAVA leave the bullish flag and now is in local channel.
Two ways now:
- if break the resist - go long (TP 6.5)
- go long if will hit the lower support of channel again
TP 6.5

High Risk KAVAUSDTPERP Short on the hourly time frameI am not taking this signal, but here's a high risk short. High risk because of BTC's weekly position. Nevertheless, this is an 8X short with liquidation as the SL and 3 TPs on the chart. Ignore that it already hit the TP1, this is a pullback limit entry Short

very easy 30% potential gain on KAVASeller are esaust, and kava pump very easly
we can see a nice retest of 5.10 usd price
