KAVAUSDT trade ideas

KAVAUSDT → Readiness to move into the distribution phase BINANCE:KAVAUSDT breaks the triangle resistance, which provokes the formation of a strong impulse. But now the price meets the flat resistance at 0.954.
On W1, the coin is starting to come to life, but is still very far away from the overall altcoin market. Trading volumes are growing when the resistance is broken, which indicates that the market is ready to realize the accumulated potential.
On D1 we are interested in the level of 0.954. A correction is possible, but we need to wait for a breakthrough and price consolidation above this area, which will be a confirmation of the market's readiness to go higher.
Support levels: 0.865, 0.694
Resistance levels: 0.954
I expect a final exit of the price from the global downtrend and subsequent growth to 1.28 and 1.55.
BINANCE:BTCUSD CRYPTOCAP:TOTAL CRYPTOCAP:TOTAL2
Regards R. Linda!

KAVA will fly soonFrom where we entered START on the chart, it seems that KAVA has started a triangle and is now completing the final wave of the triangle. It seems that the last wave of the triangle will be completed soon and we will see the KAVA pump.
Closing a daily candle below the invalidation level will violate the analysis
For risk management, please don't forget stop loss and capital management
When we reach the first target, save some profit and then change the stop to entry
Comment if you have any questions
Thank You

KAVAUSDT Elliott Waves AnalysisHello friends.
Please support my work by clicking the LIKE button👍(If you liked). Also i will appreciate for ur activity. Thank you!
Everything on the chart.
Entry: Find your entry point yourself (im in pos from 0.184)
Targets: 1.3 - 1.6 - 1.9 - 2.4
after first target reached move ur stop to breakeven
Stop: 0.67 (depending of ur risk). ALWAYS follow ur RM .
RR: 1 to 10
risk is justified
Good luck everyone!
Follow me on TRADINGView, if you don't want to miss my next analysis or signals.
It's not financial advice.
DYOR!

#KAVA/USDT#KAVA
We have a down channel that just broke out perfectly
We have a strong rising trend on RSI as well
We have stability above the Moving Average 100 and we have an upward momentum supported by the rise of Bitcoin
The pattern is canceled if the day is closed with a strong bearish candle below the green support area at 0.684.
Entry price is 0.779
The first goal is 0.810
The second goal is 0.888
Third goal 0.967

KAVA ANOTHER COIN FOR QUICK PROFIT I can tolerate the price at the moment that it can drop to 0.8, which price would it be DCA.
We see the formation of Wyckoff, many coins have already done it and the point is to find those who haven't. Coffee is one of them. There is a chance to double the profit here and I would not save it for the long term.
Momentum and volume are increasing, which is a positive sign. We will receive confirmation when the price breaks AR, 1.05
For the output, I will update if the price breaks through.
Look at the previous analyzes that were perfect and write if you are satisfied

KAVAUSDT 2D#KAVA is gonna explode. Broke the Descending triangle to the upside on the 2-day chart. Currently rejected from the EMA200 and facing horizontal resistance. It will pass both of them soon. Targets are:
$1.2027
$1.4155
$1.6283
$1.9312
$2.3170

KAVA is bullishWith the iCH and iBOS we have on the chart, a bullish view is formed on the chart.
Transfer of buy orders is progressing well
I specified the targets
Closing a daily candle below the invalidation level will violate the analysis
Note that the financial market is risky, so:
Do not enter any position without confirmation and trigger.
Do not enter a position without setting a stop.
Do not enter a position without capital management.
When we reach the first TP, save some profit and try to move the stop continuously in the direction of your profit.
If you have any comments please post them, comments will help us improve our performance
Thanks

SasanSeifi 💁♂Potential Upside in Long-Term (4-Day) AnalysisPrice broke the long-term descending trendline and had a minor uptrend after a pullback and ranging. The current price is trading at $0.94.
Expectations:
After breaking the $1 high and a minor correction, the price can further rise to the $1.20 liquidity zone and the $1.50 supply zone.
To better understand the continuation of the trend, we need to see how the price reacts to the $1.50 supply zone.
Support Levels:
$0.78 / $0.70
This is not financial advice. Always do your research before making any investment decisions.🙌
Sure, if you have any more questions or need further clarification, feel free to ask. I'm here to help!✌
if you found my analysis helpful, I would appreciate it if you could show your support by liking and commenting. Thank you!🙌

KAVA 1D BULLISH WAVEKAVA in 1D timeframe has already broken descending triangle at 0.88 zone and gaining momentum, 1.3 would be the first target for short term and for long term 2x can be expected.

KAVAUSDT breakout potentialKAVA is showing signs of life and trying to breakout after a long accumulation.

Ready for take off! 🚀Hi,
Kava is getting ready for some Impulse on the weekly chart
Position may be taken now or on the break of the Trendline.
Good Luck 🤞🏼

KAVAUSDT IDEAUPDATE
Breakout of Bearish pennant is under process in Weekly Time frame.
Successful breakout can lead 100-150% Upward move 🚀
COIN DETAILS
The live price of Kava is $ 0.787176 per (KAVA / USD) with a current market cap of $ 852.40M USD. 24-hour trading volume is $ 27.93M USD. KAVA to USD price is updated in real-time.

KAVA ❤Will retest that successful?
i think yes and new rally is happening...
i think about 2$ and 3$ 🙌🏻


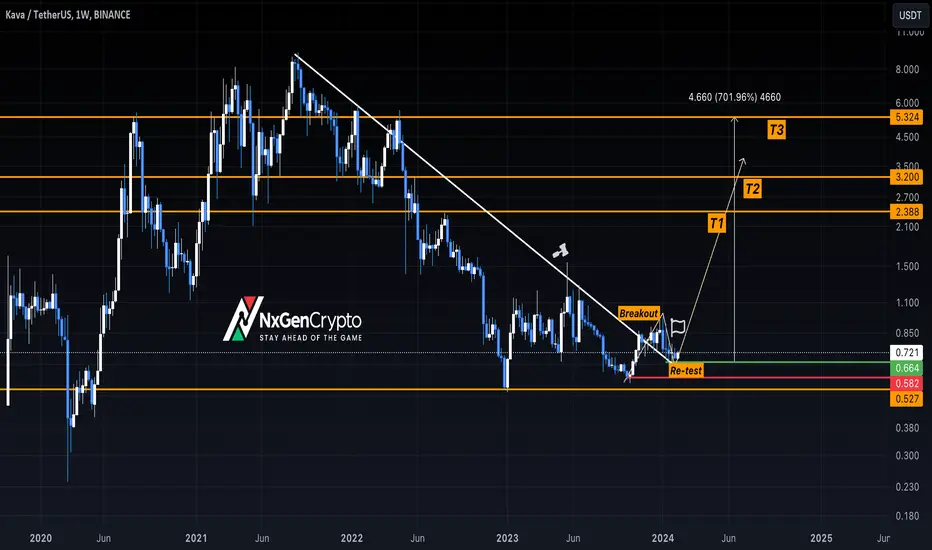
KAVA successful re-test, look ready hereKAVA looking ready after a successful re-test of the breakout
Demand Zone:
0.66 - 0.70
Sell zone:
$4.2 - $5
Risk/reward= SL 11%, Reward: 700%-+
KAVA - RISK:REWARD 1:10I must say right away that this scenario is possible only in the case of the altseason.
A deal with a very short stop, but with a very large profit.
The main thing is to keep it, in case of implementation.

KAVAUSDT Technical AnalysisIntroduction:
Hello traders and crypto enthusiasts! 🚀 Today, let's turn our attention to KAVAUSDT (Kava against USDT) and explore the compelling technical indicators that suggest a potential upward trajectory. Join us as we dissect the charts and identify bullish signals that could pave the way for positive price action.
Technical Overview:
📈 KAVAUSDT is displaying promising signs of a potential upward movement, backed by favorable technical indicators. Let's delve into key aspects and patterns that suggest an impending bullish scenario.
Conclusion:
In the dynamic crypto market, identifying potential upside opportunities is essential. KAVAUSDT is currently exhibiting bullish signals, and traders may find opportunities in the upcoming upward movement. Keep a watchful eye on the charts for confirmation of the positive trend.
Disclaimer: This analysis is for educational purposes only and should not be considered financial advice. Always conduct your research and consult with a financial advisor before making investment decisions.
#KAVAUSDT #CryptoAnalysis #TechnicalAnalysis #BullishSignals #Kava #CryptoTrading #Blockchain #TradingView #BullishOutlook

KAVAUSDT 1W LONG📈Hi all. Timeframe 1 week. KAVAUSDT has been in accumulation for more than a year with growing volumes. I am considering recruiting to the spot with a possible decrease to the ~0.555 zone. Also go long during a breakdown/retest of the accumulation channel. Marked goals and levels on the chart.

KAVA/USDT Bracing for Potential Bullish Shift👀🚀KAVA Analysis💎 Paradisers, turn your attention to #KAVAUSDT. It's showing the beginnings of what could be a bullish shift, rising from its current lower demand zone.
💎 In the face of recent market volatility and price consolidations, #kava has experienced a downtrend, currently hovering around the key demand level of $0.707. Although there's a noticeable wane in momentum, we've observed its adherence to a descending channel, respecting the channel's resistance on two occasions.
💎 This sets the stage for a likely initial drop to a lower demand level at $0.615, followed by a bullish reversal. Should #KAVA maintain its strength at this lower demand level, we might see an ascent aiming for the significant supply zone at $0.975.
💎 Given the fluid nature of the crypto market, readiness to adapt our trading strategies is crucial. If #KAVA struggles to stabilize at this pivotal point, we should be prepared for further downward movements.

KAVA looking for reversalI believe wave C should extend to the gray zone, where I'll be looking for reveral patterns.
If we break below the previous low at 0.555, the count invalidates.

Mock Up Price Action for KAVA | Mid-Long Term (12HR)Mock Up Price Action for BINANCE:KAVAUSDT | Mid-Long Term (12HR)
- Accumulating small and micro cap ALTs to hedge against market correction/pullback period to begin in earnest within the next 30 days
- KUCOIN:VELOUSDT KUCOIN:VRAUSDT KUCOIN:TELUSDT BITTREX:BAXUSDT KUCOIN:BLOKUSDT are some of my main picks, in order of preference
- With any luck, these small/micro cap ALTs will run while over the next 75 days, while BTC and the rest of the broader market top 100-200 ALTs by market cap take a nose dive into the dirt and cool down for a while
- End result, flush with profits from small/micro cap plays, at time when my primary investment interest coins like OKX:CSPRUSDT and BINANCE:XRPUSDT are at discount prices, for the last time, before the Crypto bull market starts in earnest
Personal Approach & Base Chart Setup
- Stacked Parallel Channels for Grid of Confluence Points
- High Time Frame (HTF) Fib Extensions, Retracements, & Time Cycles
- Red Filled Horizontal Rectangles between areas of major Fib level from Extensions and Retracements
- Price Label Callout with Red Circle highlighting points of interest where I'd consider making a trade
- I will consistently monitor and adjust taking into consideration long/mid/near term price action and market conditions/news

KAVAUSDTI have taken a Long position on KAVAUSDT, and this is my own idea. This trade is executed on Binance.
