KAVAUST trade ideas

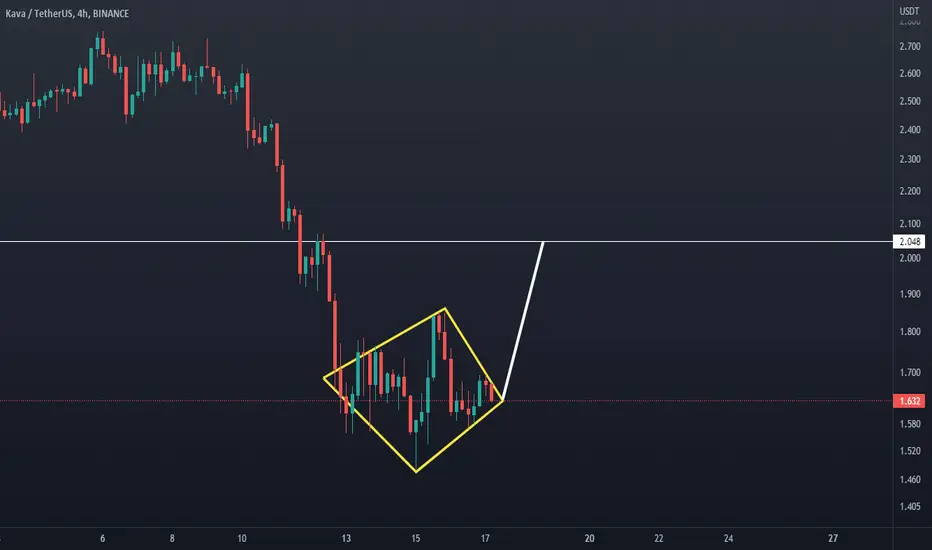
KAVUSD N wave formation formed in the 1hr timeframe. Price is also above the Ichimoku Kumo. There is also a MACD continuation cross above the zero.

KAVA giving off good vibes.KAVA is giving off some very good vibes in the way that it was bounced off this retest of this break out on the lower time frame here.
Looking for price to travel towards the 2.00 mark. Would be taking profit here, and then waiting for consolidation for any re-entry. (Or you might want to use any swing highs on lower time frame as re-entry/good places to wait for a long, if we do hit that overhead resistance).

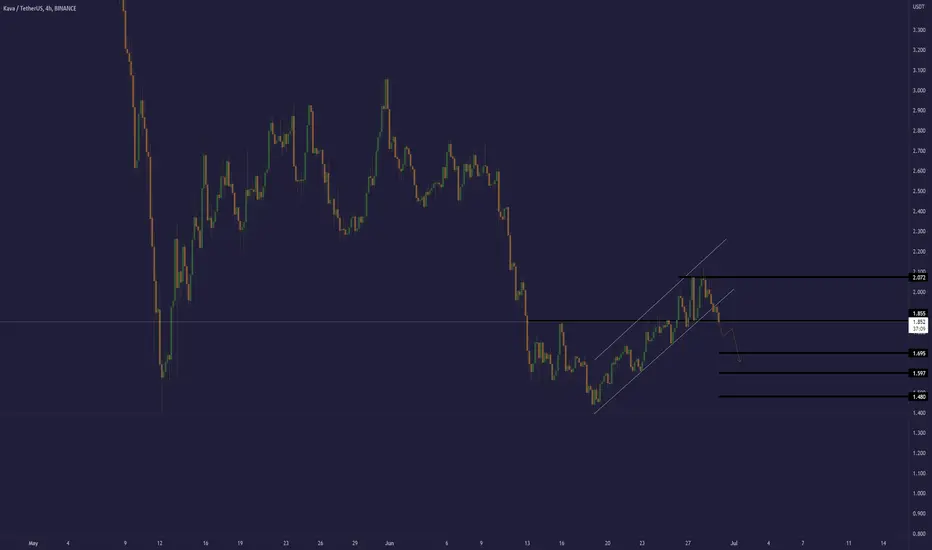
KAVAUSDT is testing the 0.618 Fibonacci levelThe price is testing the 0.618 Fibonacci level on the 4h timeframe after a bounce from the 1.4$ support where the market created a double bottom. The price lost the 4h support at 1.9$ and retest it as new resistance.
how to approach it?
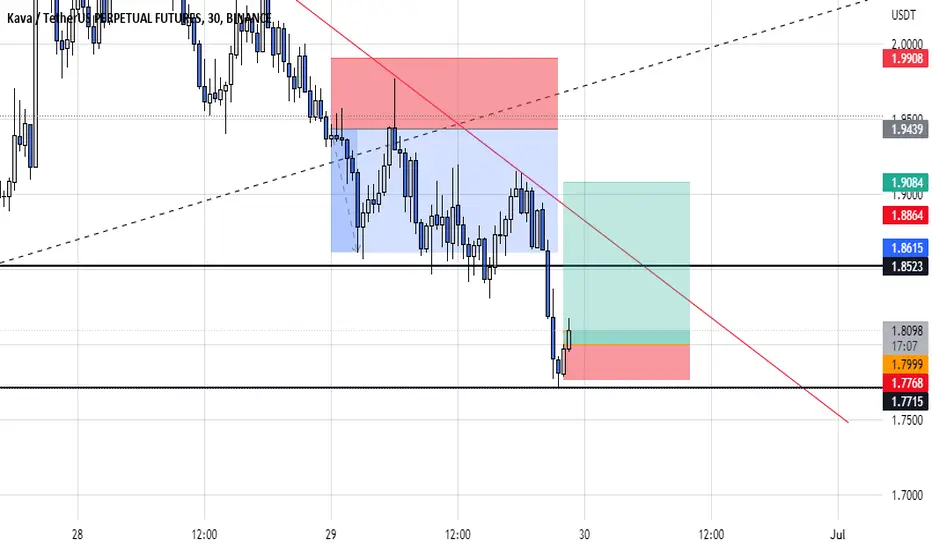
IF the price is going to lose the local 4h support at 1.7$ (on 0.618 Fibonacci level) and retest it as new resistance, According to Plancton's strategy , we can set a nice order
–––––
Keep in mind.
🟣 Purple structure -> Monthly structure.
🔴 Red structure -> Weekly structure.
🔵 Blue structure -> Daily structure.
🟡 Yellow structure -> 4h structure.
–––––
Follow the Shrimp 🦐

Short KAVAKAVA lost its trendlines for both price and RSI.
It'll continue to fall after retesting the trendlines, very likely.


KAVE possible scenariohello traders , if kava lose this istatic demand zone i expect this scenario for kava , comment below your idea ... PEACE
KAVA KAVA/USDT forming Rising Wedge Pattern on 1h Timeframe now broke Support Zone and waiting for 1.530$

KAVA Trying to breakout falling wedge>>>>>>>>>>>>>Hello EveryOne
I Have Tried My Best to Bring the best Possible outcome in this Chart.
Based on the chart KAVA USDT supported from demand zone and trying to break out of falling wedge pattern.
((Maybe)) some correct in the way's till 1.9-1.7 USDT that best opportunity to reviewing chart and set buying position.
((In the case of success to break's the green marked area on the chart<
We can get some profit from 2.0 USDT to 2.5 USDT in next day's.))
All short time support & resistance marked on the chart.
PLZ set SL for in the case of market correction.
This is not financial advise
PLZ DYOR
With hopping success>>>>>>>>>>
KAVAUSDTPERPThe price has lost its upward momentum by reaching the resistance zone, and in case of confirmation, it is suitable for entering the short trading.

kava longwaiting for supertrend indicator to flash green to enter, exit when it flash green again . above the white line + green flash = buy. flash red bellow with line = short.
dyor.

#Kava🔴Short
❇️Entry : 1.760~1.751
Max lev 3~5x
Targets : 1.728 / 1.698 / 1.669
🛑Don't risk more than 3% of capital.

KAVAUSDTPERPThis is my favorite currency from which I have taken good swings many times and I am waiting to get a good swing for the third time, but this time in the long direction, it seems that a shoulder-to-shoulder pattern is taking shape and the price can grow well from here. Have

#KAVA 4H LONG🔰 Spot & Futures
#kava/usdt
Buy : 1.580 cmp - 1.525 safe - 1.440 mart
Sell : 1.746 - 1.915 - 2.090 - 2.240 - 2.425 - 2.710 - 2.955 - 3.200
Stop : 1.360 (Daily Clsoe) DC -8%


KAVA/USDTKAVA / USDT
It is located in a downtrend channel where low channel support is lost.
It has lost support at $ 1.85 and could fall as low as $ 1.2.
#KAVA #KAVAUSDT #BTC #BTCUSD #LUNA #LUNC #UST

KAVAUSDT is testing the supportThe Price got a rejection from the 0.786 Fibonacci level and created a double top on 2.67$
On the 4h timeframe, the price is testing the previous low on 2.36$
How to approach?
IF the price is going to lose the support and create a new lower low, According to Plancton's strategy , we can set a nice order
–––––
Keep in mind.
🟣 Purple structure -> Monthly structure.
🔴 Red structure -> Weekly structure.
🔵 Blue structure -> Daily structure.
🟡 Yellow structure -> 4h structure.
–––––
Follow the Shrimp 🦐

KAVA in reaccumulation$KAVA 4h chart , things we can see:
- Asymetrical V shave recovery that lead to an ascending channel (can be considered as accumulation)
- RSI + MACD neutral
- Waves slightly positive
- Fib trace shows us the possible Liquidity check area before springing upwards
- $2.90 is the upper limit inside the range. Need to close 4h above that level in order to think that we will leave the range bullish
Bias: Neutral/Slightly bullish


Possible Ascending Triangle on KAVALooking for a Bull break on a Possible Ascending Triangle on the KAVA/USDT Chart whihc should give a measured move to around $4, retesting the previous price actions support levels to the left.

