KBBB - I won't be surprised if THEY want to hit the BLUE line :)WHOEVER IS BEHIND THIS GAME – I won't be surprised if THEY want to hit the BLUE line.
Indicators & Volume
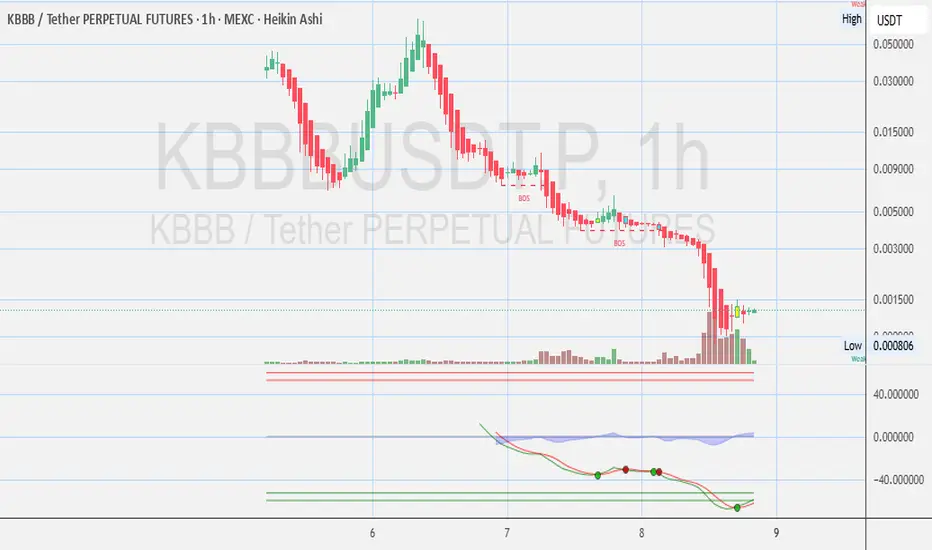
Volume Spike at Bottom: A large green volume bar formed during the last leg down, suggesting potential bottom-fishing or short covering.
BOS Labels ("Break of Structure"): Several BOS points during the decline confirm the bearish structure. No bullish BOS is visible yet — indicating trend has not reversed.
MACD/RSI-style Indicator (Below Chart):
Appears to show bullish momentum divergence: The price made lower lows, but the momentum is slightly rising.
Green dots on the indicator line signal a potential local bottom, but not yet strong confirmation of trend reversal.
-----------------------
Disclosures:
NO positions.
This analysis is for informational purposes only and is not financial advice. It does not constitute a recommendation to buy, sell, or trade any securities, cryptocurrencies, or stocks. Trading involves significant risk, and you should consult with a qualified financial advisor before making any investment decisions. Past performance is not indicative of future results.
KBBBUSDT.P trade ideas

KBBB - 1 Hour Chart - $540K Market Capital - Opinions?1 Hour Chart: Stoch RSI Shows Potential Reversal Momentum.
Any Opinions?
Disclosures:
This analysis is for informational purposes only and is not financial advice. It does not constitute a recommendation to buy, sell, or trade any securities, cryptocurrencies, or stocks. Trading involves significant risk, and you should consult with a qualified financial advisor before making any investment decisions. Past performance is not indicative of future results.

KBBB 45Min Chart Stoch RSI Shows Potential Reversal AnyOpinios? 45-Min Chart: Stoch RSI Shows Potential Reversal Momentum Any Opinions?
Disclosures:
No positions.
This analysis is for informational purposes only and is not financial advice. It does not constitute a recommendation to buy, sell, or trade any securities, cryptocurrencies, or stocks. Trading involves significant risk, and you should consult with a qualified financial advisor before making any investment decisions. Past performance is not indicative of future results.

KBBB - 45 Minutes Chart - Potential Bottom? Opinions? Disclosures:
No positions.
This analysis is for informational purposes only and is not financial advice. It does not constitute a recommendation to buy, sell, or trade any securities, cryptocurrencies, or stocks. Trading involves significant risk, and you should consult with a qualified financial advisor before making any investment decisions. Past performance is not indicative of future results.

KBBB - Over 97% drop means Bottom fishing? Any Opinions? Indicators & Volume
Volume Spike at Bottom: A large green volume bar formed during the last leg down, suggesting potential bottom-fishing or short covering.
BOS Labels ("Break of Structure"): Several BOS points during the decline confirm the bearish structure. No bullish BOS is visible yet — indicating trend has not reversed.
MACD/RSI-style Indicator (Below Chart):
Appears to show bullish momentum divergence: The price made lower lows, but the momentum is slightly rising.
Green dots on the indicator line signal a potential local bottom, but not yet strong confirmation of trend reversal.
-----------------------
Disclosures :
No positions.
This analysis is for informational purposes only and is not financial advice. It does not constitute a recommendation to buy, sell, or trade any securities, cryptocurrencies, or stocks. Trading involves significant risk, and you should consult with a qualified financial advisor before making any investment decisions. Past performance is not indicative of future results.