KCS - Potential Bullish Reversal!Hello TradingView Family / Fellow Traders. This is Richard, as known as theSignalyst.
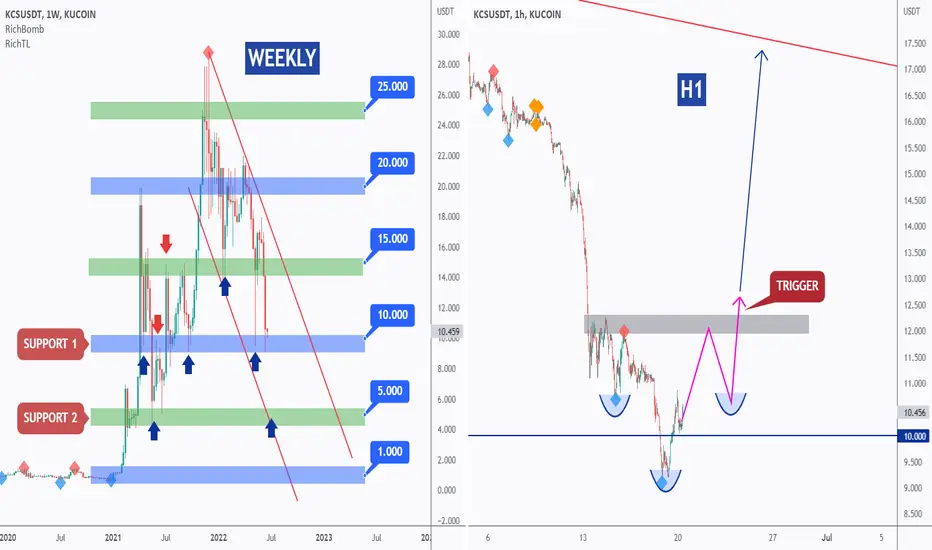
WEEKLY: Left Chart
KCS is approaching a strong support zone and round number 10.0 so we will be looking for buy setups on lower timeframes.
H1: Right Chart
KCS is forming an inverse head and shoulders pattern, but it is still an idea.
Trigger => Waiting for the right shoulder to form then buy after a momentum candle close above the gray neckline.
Meanwhile, until the buy is activated, KCS can still trade lower and break the 10.0 support. In this case a movement till the 5.0 support would be expected.
Always follow your trading plan regarding entry, risk management, and trade management.
Good luck!
All Strategies Are Good; If Managed Properly!
~Rich
KCSUSDT trade ideas
🔥 KCS Bearish Channel: Another ReversalSome time ago I made an analysis on KCS and the bearish channel it was trading in.
The trade almost played out to the letter, so congratulations if you took the trade.
In this analysis we're scouting the same trade: a bullish reversal from the bottom of the channel towards the top resistance. Might want to wait for BTC to trade above $20k again to confirm short-term bullish bias.

KUCOIN HAVE CHANCES TO MAKE NEW MOVE DOWNHello my friends, today I want to talk with you about KCS.
Price was in downtrend and close under good area (~12.100-13.100).
After that we saw that KuCoin was in channel during some time.
Now price is close to break channel and I'm waiting for new downtrend.
We can open short position as soon as KCS will break next support (9.500).
As a target we can take next good level (7.750).
So be ready for such scenario.
This is an article, not financial advice, always do your own research.
If you have any questions, you can write it in comments below, and I will answer them.
And please don't forget to support this idea with your like and comment, thank you.

KCSUSDT 1D On the chart, the global "Bull flag"Looking at the schedule of the KCSUSDT, we clearly see that from the end of 2021 the price is in a trend of falling and clearly moves the channel down.
However, there was an interesting nuance recently. At this time, when the BTC and ETH was strongly updated the minimums, which were previously installed in the May fall, the price of KCS did not update minimum at least.
We bring to your attention a potential trade within the channel:
Entrance $11-11.50
Stop below $9.44
Take Profit $17.94
Profit/loss ratio 4/1
_______________________________
Since 2016 , we have been analyzing and trading the cryptocurrency market.
We transform our knowledge, trading moods and experience into ideas. Each "like under the idea" boosts the level of our happiness by 0.05%. If we help you to be calmer and richer — help us to be happier :)

KCS | KuCoin Token | Time TO Explode Again | Don't Miss ItKCS | KuCoin Token | Time TO Explode Again | Don't Miss It
During the previous crash that LUNA created, we saw all the currency pairs moving lower.
That movement on Tokens of the exchanges happened due to the high volatility and withdrawal
that many traders did in panic.
During that moment the price created the harmonic pattern that I pointed out on the chart.
This pattern pushed the price up again and very fast by creating a profit of +80%.
it was a wonderful price recovery.
On the other hand, Celsius created the same mess in the market.
The price on KCS is close to the pattern again and it is holding better compared to Bitcoin depreciation.
From this price $11 I am expecting another minimum movement between +65% to +80% profit again on KuCoin (KCS) token
Thank you and Good Luck!

KNC/USDT is following bearish marketHey Traders,
We see a nice possibility for KNC to go for that support line that we have placed near $10. We are waiting for breakdown from that as it is in a bearish trend. 2 times it has broken down now we need that third time before we would be ready to long.
If you like ideas provided by our team you can show us your support by liking and commenting.
Yours Sincerely,
Swallow Team
Disclamer:
We are not financial advisors. The content that we share on this website are for educational purposes and are our own personal opinions.

KCS/USD - KuCoin returns to $10. At Critical Support! 😱KCS had a nice rally in late May, but this quickly reversed in June with the price now back on the key support at $10.
The whole market crashed and ETH fell under its old all-time high. If Bitcoin crashes under $20k, then most altcoins will likely make lower lows.
What does this mean for KCS?
Probably a price under $10.
Bulls have to do their best to keep the price above this key level as otherwise the next support is found at $9 which would put KCS into single digits.
The indicators on higher timeframes remain bearish, while the shorter timeframes like 4-hours are bullish. This suggests a short relief will be followed by more pain.
A break below the support at $10 will settle any doubts. Bias is bearish for now.
Like and follow if you like my idea!

KCSUSDT SHARK PATTERNThe Shark pattern is a distinct 5-point reversal structure that was discovered by Scott Carney in 2011. It is similar to the Bat Pattern, except for the C point exceeding the BC leg. It can point to a strong counter-trend move. The potential Reversal Zone (PRZ) is defined by the following harmonic levels: the 0.886 retracement of initial leg and the 1.13 reciprocal ratio of the initial leg. Targets can be various retracements of the CD leg, all the way up to C itself. There are different methods of determining where the stop would go. Some put it beyond the next structure level after the D point, others choose the 1.41 extension of XA.
Conservative traders look for additional confirmation before entering a trade based on an indicator value, a specific candlestick pointing at a reversal or confluence with other methods. The Shark pattern can be either bullish or bearish. It is as effective as other harmonic patterns and a common variation on trading this pattern is to trade the last leg to completion. TradingView has a smart drawing tool that allows users to visually identify this price pattern on a chart.

KCS - Strong Zones!Hello TradingView Family / Fellow Traders. This is Richard, as known as theSignalyst.
KCS is approaching a a strong support zone and round number 10.0 so we will be looking for buy setups on lower timeframes.
As per my trading style:
As KCS approaches the 10.0 zone, I will be looking for reversal setups (like a double bottom pattern, trendline break, and so on...)
Unless the 10.0 support is broken, then a movement till the 5.0 support where we will be looking for buy setups.
Always follow your trading plan regarding entry, risk management, and trade management.
Good luck!
All Strategies Are Good; If Managed Properly!
~Rich

KuCoin is continue fallingHello TradingView community and my subscribers, please if you like ideas do not forget to support it with your like and comment, thank you so much and we will start.
Today I want talk with you about KCS/USDT chart.
Price broke wedge and support zone.
Also Kucoin found new resistance level (12.15$) and tested it.
Price is falling now and I think that KCS/USDT can reach support level (9.5$) soon.
So, I'm waiting for this scenario.
This is my opinion, I really hope this will be useful for you.
Be ready and take care your money. Have a great profit !

KCSUSDT near the 2 year Support trend-lineThe KuCoin token (KCSUSDT) has followed the overall crypto market to the downside this past week, with the 1D RSI marginally breaking below the oversold 30.00 level. However, there is no cause for concern that the long-term bullish trend is reversing, as the Higher Lows trend-line that has been supporting the price since the February 28 2021 Low and held on another five Higher Lows, hasn't yet been reached.
In fact, the price, on RSI and candle terms, seems to be following the bottom sequence of May 19 - 2021 - June 22 2021. Technically, the next time the 1D MA50 (blue trend-line) breaks, we should return to the bullish trend within this Fibonacci Channel.
--------------------------------------------------------------------------------------------------------
** Please support this idea with your likes and comments, it is the best way to keep it relevant and support me. **
--------------------------------------------------------------------------------------------------------

KCSUSDT pullback?The price tested the 18$ as I said in my previous ideas but the market didn't create a breakout from that region for a new long. Now the price comes back to the daily support on 11$.
the price is testing the 4h resistance on 12$ as new resistance below the daily one.
How to approach it?
IF the price is going to have a breakout from the daily and retest the daily as new support, According to Plancton's strategy , we can set a nice order
–––––
Keep in mind.
🟣 Purple structure -> Monthly structure.
🔴 Red structure -> Weekly structure.
🔵 Blue structure -> Daily structure.
🟡 Yellow structure -> 4h structure.
–––––
Follow the Shrimp 🦐

KCSUSDT🔥 IT CAN BE EASY 8%Greetings to all👋
KCS is in a downtrend, I think it is still going to the lower support limit of $14
I think the instrument will soon begin an upward movement towards the trend line of resistance, so far we can wait for a pullback and go from the support zone to LONG. Profit 16.5$
✅Do not forget to visit the channel there is a lot of useful information about trading.Greetings to all👋

KuCoin is finishing trip in the wedgeHello TradingView community and my subscribers, please if you like ideas do not forget to support it with your like and comment, thank you so much and we will start.
Today I want talk with you about KCS/USDT chart.
Price can reach support zone soon and after that we will wait for new info.
KuCoin will probably bounce and will start making new uptrend.
I suppose that price can try back to the interesting resistance zone.
So, I'm waiting for this scenario.
This is my opinion, I really hope this will be useful for you.
Be ready and take care your money. Have a great profit !

KCSUSDT 1D Long-term investment #1At the beginning of the year, we have published a serial of ideas introduced an investment trade into token Kucoin KCS, with a weekly updating of our opinions about the KCSUSDT price movement, and how we manage the position
The result is the break-even stop for +2.5% that we received when the whole cryptomarket began to fall.
More detail what we have chosen this token for medium(long)-term investment and the last update of the idea below:
Further, we only do shot short trades, because the market went into the stage of correctional fall.
And the other day, we have released a global idea on BTCUSDT, which noted that in our opinion, the price is now in a critical zone from where a not bad grew could be organized. More in more detail in the idea below:
Therefore, we will try to restore the investment section in the KCS, and every week we will update the information how we manage the position.
Considering that we expect growth in BTCUSD pair is a big chance that the rest of the cryptocurrencies will be tightened up by the main trade couple.
The price of KCSUSDT has bounced very well after May fall and now, after a weak correction (which may indicate the power of buyers) tries to fix above the mirror level of $15.00
Therefore, given the above facts, we offer the following input data for a long -term position:
Entrance in the range of $15.25-15.75
Stop below $10.99
Take Profit in the area of $41.50
Profit/loss ratio 6/1
We expect that the summer can give a not bad wave of growth, of course, if there are no force Major.
So, if you are interested in this section: Put a like, write a comment and subscribe to us , and we will update the information every week how we manage this position and what we see new ones on the KCSUSDT chart.

KUCOIN BREAK SUPPORT LINEHello my friends, today I want to talk with you about KCS/USDT.
Price was trading during some time along support line and broke it.
I'm waiting that it was a signal for some downtrend.
I believe that KCS can fall to support (15.000) to retest.
If price will pull back, we will have good chance to open long position cause the KuCoin can back to resistance area.
So be ready for such scenario.
This is an article, not financial advice, always do your own research.
If you have any questions, you can write it in comments below, and I will answer them.
And please don't forget to support this idea with your like and comment, thank you.

KCS | Bullish wedge patternKCS (KuCoin Token) bullish wedge pattern
We can see from the chart that it's forming an bullish wedge pattern
Buy on breakout
Targets:
18.38
19.88
21.20

KCS | KuCoin Token | Bullish Wedge PatternKCS | KuCoin Token | Bullish Wedge Pattern
From the chart we can see that KuCoin is developing a wedge pattern.
from the previous idea, it was transformed from a triangle to a wedge pattern.
As long as we don't buy before the breakout all is fine for us.
However, I am still very bullish on KCS despite the bearish situation that has covered all the crypto markte.
Targets:
🎯 18.38
🎯 19.88
🎯 21.20
Thank you and Good Luck!

KCSUSDT Good Area For Long PositionKucoin Usdt complete ABC correction and excellent price to enter a buy position with stop loss and two tp
KCSUSDT broke below its Channel. Levels to consider.The KuCoin token (KCSUSDT) broke today below the Channel Up pattern it has been trading in since the 2nd half of May. The obvious Support to look for now is the 4H MA200 (orange trend-line), with the next ones (14.930, 14.130 and 13.520), being the Higher Lows during the uptrend after the May 12 low. Every one of those Support levels can provide a rebound, so buying there with the SL just below them, constitutes a sound trade from a Risk/ Reward ratio perspective.
On the other hand a daily closing below 13.520, technically restores the long-term bearish trend. If you are looking for a confirmed buy, perhaps it would be best to wait for the 4H RSI to break above its upper Bollinger.
--------------------------------------------------------------------------------------------------------
** Please support this idea with your likes and comments, it is the best way to keep it relevant and support me. **
--------------------------------------------------------------------------------------------------------

KuCoin can grow higher Hello TradingView community and my subscribers, please if you like ideas do not forget to support it with your like and comment, thank you so much and we will start.
Today I want talk with you about KCS/USDT chart.
Price is trading now in wedge and is close to support level and support line.
I think that this area will be good place to make new impulse.
KuCoin can finish way in wedge and bounce from there.
Price can start growing and reach resistance level.
So, I'm waiting for this scenario.
This is my opinion, I really hope this will be useful for you.
Be ready and take care your money. Have a great profit !

KCS - Video Top-Down Analysis!Hello TradingView Family / Fellow Traders. This is Richard, as known as theSignalyst.
Here is a detailed update top-down analysis for KCS.
Which scenario do you think is more likely to happen? and Why?
Always follow your trading plan regarding entry, risk management, and trade management.
Good Luck!.
All Strategies Are Good; If Managed Properly!
~Rich

KCS | KuCoin Token | Time For Another Bullish WaveKCS | KuCoin Token | Time For Another Bullish Wave
During the previous analysis, the price moved very well in KuCoin Token
and we closed very nice profits on the short term targets.
Actually, the price is creating a type of triangle pattern and it is showing
the potential for more increases in the price movement.
Targets:
🎯 18.38
🎯 19.88
🎯 21.20
Thank you and Good Luck!
