KCS/USD - Momentum Stalling, Here's the Critical Support 😲 KuCoin token had a good rally, actually, a great one considering other coins barely bounce (hint hint at Bitcoin).
KCS almost doubled in price compared to its local bottom here, so not bad at all.
However, the momentum seems to be shifting against KCS and its price may roll over and fall lower to the key support at $14.
If the selloff will not be too aggressive I can totally see KCS hold well there before attempting to recovery again and rally.
For now, the daily MACD is curving down and may turn bearish, so it will take some time for this to play out. Volume is also terribly low.
Bias is turning bearish on this price action, but wait for Monday to get more confidence in the price action.
Like and follow if you liked this analysis!
KCSUSDT trade ideas

KuCoin - CollapseI am hoping this coin can respect this area of daily supply to give a beautiful drop in price to the remaining fair value gap areas.
I will be looking for entry points on the lower time frames.

KuCoin uptrend can be expected to continue.After the break above the trendline, we might be seeing a continuation of the uptrend. Potentially, the price should be aimed at the top of the ascending channel.

KUCOIN IS IN STEP FROM NEW UPTRENDHello my friends, today I want to talk with you about KCS/USDT.
Price is growing along support line and reached resistance area.
I'm waiting that KCS can make last retest of this line and will start making good uptrend.
We can open long position as soon as price will break resistance area.
As a target we can take nearest good area (~21.500).
So be ready for such scenario.
This is an article, not financial advice, always do your own research.
If you have any questions, you can write it in comments below, and I will answer them.
And please don't forget to support this idea with your like and comment, thank you.

KCS - Trend-Following Setup!Hello TradingView Family / Fellow Traders. This is Richard, as known as theSignalyst.
KCS rejected our green support and traded higher, so we are currently trading inside this orange channel.
As per my trading plan, I will be looking for trend-following buy setups on lower timeframes if price retests the lower orange trendline acting as a non-horizontal support.
and we will be expecting the bears to take over for a correction after retesting the upper orange/red trendlines.
Which scenario do you think is more likely to happen? Which floor is more likely to hold?
Always follow your trading plan regarding entry, risk management, and trade management.
Good luck!
All Strategies Are Good; If Managed Properly!
~Rich

KCSUSDT testing the 1D MA100, close to a major break-outThe KuCoin token (KCSUSDT) has broken since our last analysis above the 1D MA50 (blue trend-line) for the first time since April 26 2022. On top of that, the 1W MA50 (red trend-line) is now supporting. At the moment it is going for a re-test of the 1D MA100 (green trend-line) where it failed yesterday.
Perhaps the most important barrier, above which the long-term trend switches back to bullish, is the 1D MA200 (orange trend-line), which right now happens to be exactly on the Lower Highs trend-line that started after the December 01 2021 market Top.
Naturally if we get a weekly candle close above the 1D MA200, we should expect a medium-term rally towards the 28.845 Resistance (Dec 01 2021 High). If not, the Lower Highs can very well reject the price back towards the 14.500 level.
Even though the current Channel Up resembles the one that also tested the 1D MA100 back in early February, this time the price has broken above the critical 0.618 Fibonacci retracement level, making a full gap fill more probable. Also keep an eye on the 1W RSI. If it crosses above its MA (yellow line) then that also favors the bullish case on the long-term.
Overall we believe that KCSUSDT is an excellent investment on the long-term with a 10x profit potential in this Cycle.
--------------------------------------------------------------------------------------------------------
Please like, subscribe and share your ideas and charts with the community!
--------------------------------------------------------------------------------------------------------

KuCoin | We Already Closed +10% to +17% on the first wave! Next?KuCoin | We Already Closed +10% to +17% on the first wave! Next?
From the previous idea, the price recovered very well and we made +10% to +17%
profits on the bullish movement.
This movement was also supported by Bitcoin recovery.
Now I am expecting the price to stay above the structure and it can begin the bullish movement
again. The maximum pullback that I am expecting is up to 16.97
Targets:
🎯 19.88
🎯 21.20
Thank you and Good Luck!
Previous Analysis:

KCSUSDT had a breakout! 18$ is coming!From my first idea, the price gained 37%.
now the market is testing the 4h resistance after a breakout from the descending channel, and as I told you in my previous analysis, the price wants to retest the 18$, it's a key level.
How to approach it?
The price needs to create a clear breakout from the 17$ resistance, According to Plancton's strategy , we can set a nice order
–––––
Keep in mind.
🟣 Purple structure -> Monthly structure.
🔴 Red structure -> Weekly structure.
🔵 Blue structure -> Daily structure.
🟡 Yellow structure -> 4h structure.
–––––
Follow the Shrimp 🦐

#KCS/USDT 12Hr UPDATE !!Hello, dear traders welcome you to this KCS/USDT chart analysis.
Hello dear traders, we here new so we ask you to support our ideas with your LIKE and COMMENT, also be free to ask any question in the comments, and we will try to answer for all, thank you, guys.
KCS/USDT bullish cup and handle pattern create and retest buy the green zone and the dip.
Remember:-This is not a piece of financial advice. All investment made by me is at my own risk and I am held responsible for my own profit and losses. So, do your own research before investing in this trade.
Thanks for your time, we hope our work is good for you, and you are satisfied, we wish you a good day and big profits.
THANK YOU.

💡Don't miss the great buy opportunity in KCSUSD @kucoincom
Trading suggestion:
". There is a possibility of temporary retracement to the suggested support line (15.851).
. if so, traders can set orders based on Price Action and expect to reach short-term targets."
Technical analysis:
. KCSUSDT is in a range bound, and the beginning of an uptrend is expected.
. The price is above the 21-Day WEMA, which acts as a dynamic support.
. The RSI is at 78.
Take Profits:
TP1= @ 17.173
TP2= @ 18.469
TP3= @ 19.521
TP4= @ 20.621
TP5= @ 21.556
SL= Break below S2
❤️ If you find this helpful and want more FREE forecasts in TradingView
. . . . . Please show your support back,
. . . . . . . . Hit the 👍 LIKE button,
. . . . . . . . . . Drop some feedback below in the comment!
❤️ Your support is very much 🙏 appreciated! ❤️
💎 Want us to help you become a better Forex / Crypto trader ?
Now, It's your turn !
Be sure to leave a comment; let us know how you see this opportunity and forecast.
Trade well, ❤️
ForecastCity English Support Team ❤️

KCS/USD - Retest of $21 imminent! 🚀KuCoin Token is on a clear bullish path and about to recover most of its recent losses during the May crash.
At this rate, the bullish momentum should take KCS to the $21 key resistance level.
More so, the indicators are turning quite bullish on higher timeframes.
In this 3-day timeframe, the MACD just did a bullish crossover, this is very significant. So did OBV.
Could this build enough momentum to break above $21? Possibly, particularly because KCS already broke the resistance on the BTC pair (price went above 5k satoshi).
Bias is bullish on this price action and I would re-assess at $21.
Keep a close eye on this!
Like and follow if you liked my idea!

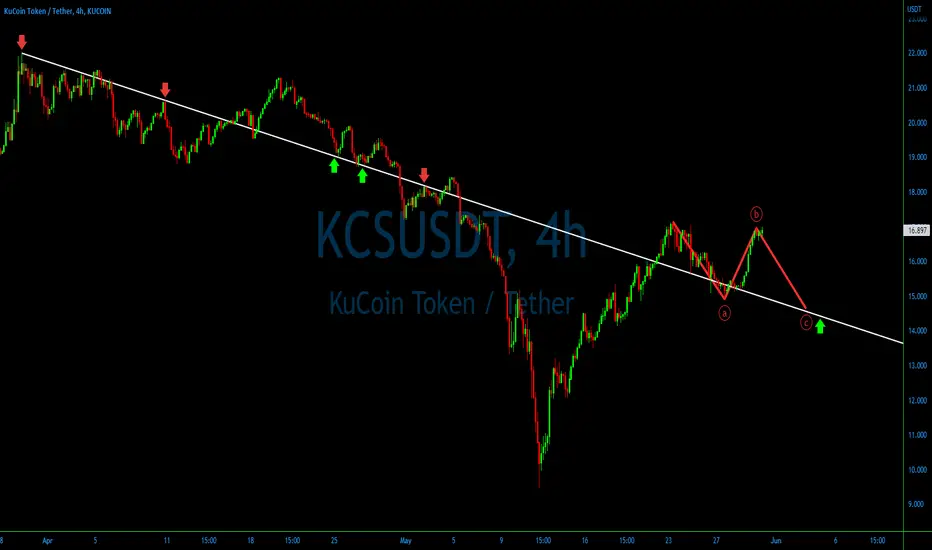
Kucoin might form an ABC corrective patternWe already see a strong recovery by KCS and this can eventually turn into an uptrend. Although as long as the recent high holds, there is a chance of an ABC corrective pattern.
KCS/USDTkcs / usdt
It is located in a long-term downtrend.
Break your $ 17 resistance.
If it can break the $ 19.5 range, it could rise to the $ 27 range.
#KCS #KCSUSDT #BTC #BTCUSD #LUNA #LUNC #UST

KCS | KuCoin Token | One Channel At a TimeKCS | KuCoin Token | One Channel At a Time
After BTC dragged down all the other cryptocurrecies the market looks
like it is moving from the panic side and it is getting back to the normal trading routine.
This is getting more clear now as long as the broker's token is recovering very well in price.
The price is correcting lower and it looks like it is close to the completion of a
"Descending Channel Pattern"
The minimum movement that will come for the short term traders it will be +11%
Thank you and Good Luck!

KCSUSDT wants to retest the 18$From my previous analysis we made more than 27% and the price followed my drawing. Now the price is testing the monthly as new support after the first rejection.
The market created a V pattern on 10$ and now the price wants to retest the 18$.
How to approach?
IF the price is going to have a breakout from the 4h resistance According to Plancton's strategy , we can set a nice order
–––––
Keep in mind.
🟣 Purple structure -> Monthly structure.
🔴 Red structure -> Weekly structure.
🔵 Blue structure -> Daily structure.
🟡 Yellow structure -> 4h structure.
–––––
Follow the Shrimp 🦐

KuCoin KCS; Possible Bullish ReversalHello Traders! CTDave here again with another daily price analysis chart.
Today I will be analyzing the Kucoin token KCS.
Let's take a look at the 15-minute timeframe first:
So as you can see, there is a downward channel that formed. Right now, it has hit the support So you can expect a tiny reversal to the next resistance area. After that, a drop can be expected to around ~$13.50 which is indicated by the red arrow going down with a small retrace, as you can see. Afterward, a rise will follow up to the orange resistance line.
Now, let's look at the 2-hour timeframe:
As you can see, we are in a bullish breakout triangle which is inside another breakout triangle as can be seen from the 1-day timeframe:
Thanks for reading!
As always, I encourage everyone to please like, comment, and share my ideas, and follow me for more of these posts to be kept updated. Happy trading! Thank you!
Note: I am not a financial advisor, please do not trade solely based on my trading decisions. Do your own research or consult a professional financial advisor before conducting a trade.

KCSUSD ❕ downtrend channelKuCoin Token broke the uptrend channel.
The price is testing 50MA on 30m Timeframe and moving in downward channel near an upper boundary.
I think that the price will test an upper boundary of channel and it will fall after fixing under boundary.

Will KCS/USDT back to downtrend ?Hello TradingView community and my subscribers, please if you like ideas do not forget to support it with your like and comment, thank you so much and we will start.
Today I want talk with you about KCS chart.
Price was close to the last strong support line and bounced.
KuCoin can start making new downtrend now or after one more retest or support line.
Price can support level ($15) after that and probably will break it.
If this will happen, KCS can go lower and have chances reach support zone.
So, I'm waiting for this scenario.
This is my opinion, I really hope this will be useful for you.
Be ready and take care your money. Have a great profit !

KuCoin Token (KCS) - May 26hello?
Traders, welcome.
If you "follow", you can always get new information quickly.
Please also click "Like".
Have a nice day.
-------------------------------------
(KCSUSDT 1W Chart)
Below the 6.859-7.562 section: There is a possibility of entering the mid- to long-term investment area.
Above 10.230: Expected to create a new wave
(1D chart)
If it finds support above 15.880, I expect it to turn into an uptrend in the short and medium term.
However, due to the volatility of BTC, there is a possibility of temporarily touching the 13.450-14.093 section, so careful trading is required.
(buy)
- 1st buy: After confirming support at 15.880
- 2nd purchase: After confirming support near the 13.450-14.093 section
(Stop Loss)
- When it falls below 12.511
(Sell)
- When receiving resistance near 19.007
- When receiving resistance in the section 21.376-22.189
------------------------------------------------------------ -----------------------------------------------------
** All indicators are lagging indicators.
Therefore, it is important to be aware that the indicator will move accordingly as price and volume move.
However, for convenience, we are talking in reverse for the interpretation of the indicator.
** The MRHAB-T indicator used in the chart is an indicator of our channel that has not been released yet.
** The OBV indicator was re-created by applying a formula to the DepthHouse Trading indicator, an indicator disclosed by oh92. (Thanks for this.)
** Support or resistance is based on the closing price of the 1D chart.
** All descriptions are for reference only and do not guarantee a profit or loss in investment.
(Short-term Stop Loss can be said to be a point where profit and loss can be preserved or additional entry can be made through split trading. It is a short-term investment perspective.)
---------------------------------

KuCoin - Under the HoodThis is purely our Technical analysis and our humble opinion.
So, don't get us wrong KuCoin is a nice exchange; not the best but it's good. We have done all kinds of research and testing and it is not our favorite but it ranks in the Top-7 of our research.
Regarding our chart:
16,25 is a BIG resistance and the price does not seem to have the momentum to rise higher.
What is worrying us is that the next support is at 9,45 which is very far away... and this calls us to go short here.
Again, that's our opinion, DYOR as always and remember to HEDGE.
One Love,
the FXPROFESSOR

KuCoin | Gartley Pattern Is Developing Well | Next Target $20KuCoin | Gartley Pattern Is Developing Well | Next Target $20
From the previous analysis on KCS (Kucoin Token), we can see that the
Harmonic Gartley Pattern worked out very well.
The price reached the first target and now I am expecting only a small pullback.
However, this pullback may not happen as well.
If the price will move lower we will have the possibility to buy again and the first
short term target will be the top of the flag at 17.11
Next target will be 20
Thank you and Good Luck!

KUCOIN WILL CONTINUE GROWING ! BUT WHEN ?Hello my friends, today I want to talk with you about KCS/USDT.
Price reached resistance area and is trading in range now.
I'm waiting that KuCoin will test this area and break range soon.
I think can be two ways of growing.
If price will break upside of range, KCS/USDT can also break resistance area and try reach step by step next resistance (21.200).
But if KuCoin will break downside of range, price can go down at first to retest support (13.850).
In my opinion price can pull back after that and try to make new uptrend.
So be ready for such scenario.
This is an article, not financial advice, always do your own research.
If you have any questions, you can write it in comments below, and I will answer them.
And please don't forget to support this idea with your like and comment, thank you.
