KuCoin token accumulation inside triangle, breakdown up or down?Hello my friends, today I want to talk with you about KCS.
Big triangle from previous my ideas is still valid.
Now price accumulating inside triangle near support line.
In the majority of cases in such situations after accumulation price coming to top part of triangle.
This is our resistance level 21 USD
So I'm waiting for next upward movement to resistance.
In resistance area we will need to make update for situation.
But if market will continue to be bullish I think KCS can break resistance at 21 and go higher.
Targets the same 24-25 USD first target and 27-28 USD second target.
So be ready for such scenario.
This is an article, not financial advice, always do your own research.
If you have any questions, you can write it in comments below, and I will answer them.
And please don't forget to support this idea with your like and comment, thank you.
KCSUSDT trade ideas

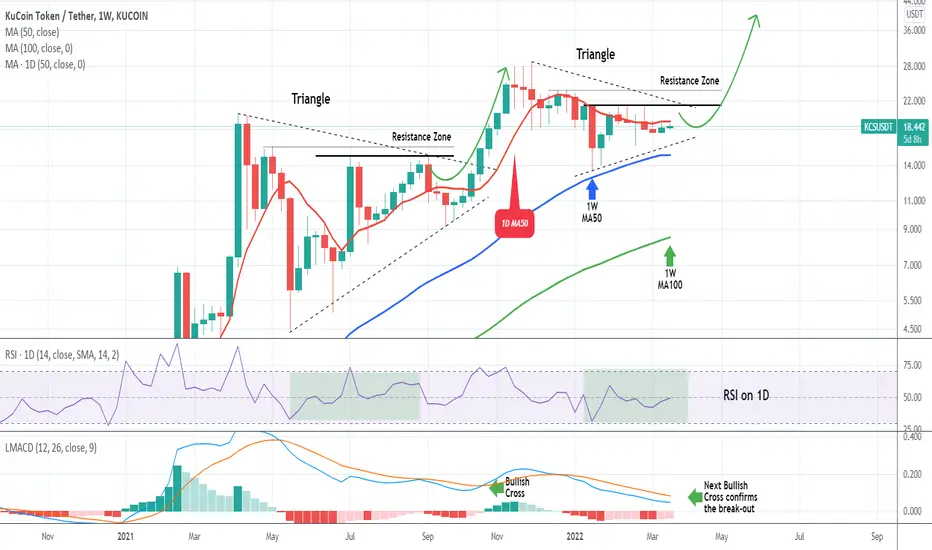
KCSUSDT Triangles on the 1W chart. Look for break-outs.I decided to make an analysis of the KuCoin token on the 1W time-frame in order to give you a better understanding of how similar the market structure since the November High is with that of April - September 2021.
As you see, both patterns are Triangles and the 1W chart helps at realizing the levels we need to pay attention in order to spot the next rally before it begins. Right now the price is below the 1D MA50 (red trend-line) but above the 1W MA50 (blue trend-line) which has been supporting since January 2021. There is a specific Resistance zone to beat, which as per the 2021 Triangle, is made of the last two Lower Highs. A break above this level, will also be a break above the Triangle and the 1D RSI shows that we may have just one pull-back left to the bottom of the Triangle, before the new rally that will cause the break-out begins. The next time the LMACD makes a Bullish Cross, will be a (rather late) confirmation.
--------------------------------------------------------------------------------------------------------
** Please support this idea with your likes and comments, it is the best way to keep it relevant and support me. **
--------------------------------------------------------------------------------------------------------
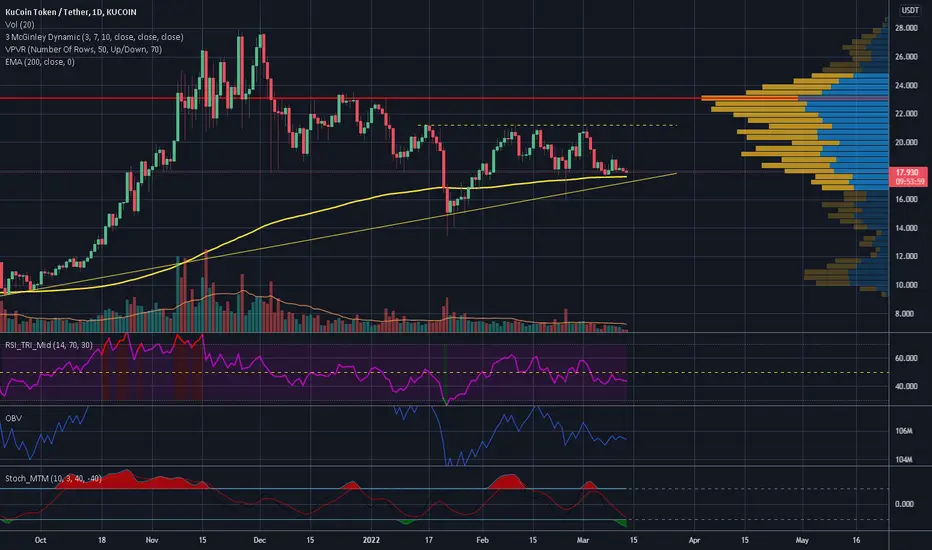
KCS/USD - Kucoin Token Holds above $18. Where Next?KCS appears to be in a long consolidation with price within a large range from $21 acting as resistance to $18 acting as support.
This flat trend is not very excited and a break of the key levels is needed for KCS to move passed these levels. The indicators are also rather flat in line with the price action.
The recommended course of action in such cases is to be patient and wait for the price to break away, otherwise taking a large position here can be quite risky.
Both the MACD and RSI are hovering around mid-levels and a trend is yet to emerge.
Volume remains low, but the OBV indicates a bullish bias with a crossover above the moving averages.
Best to be patient at this time.
Bias is neutral and will change only when one of the key levels is broken.
Like and follow if you liked my idea!

Local timeframe update for global KCS chart to previous ideaHello TradingView community and my subscribers, please if you like ideas do not forget to support it with your like and comment, thank you so much and we will start.
Today I want talk with you about KCS chart.
This is idea is local view for my previous global idea for KuCoin token KCS.
As you can see on local timeframe price is still trades in accumulation zone 18-21
And now price very close to local support trend line.
I'm still think that price can continue to grow.
At first to top part of accumulation is level 21 usd.
And after breakdown price can go higher to 24 usd.
So, I'm waiting for this scenario.
This is my opinion, I really hope this will be useful for you.
Be ready and take care your money. Have a great profit !

Big move on KCS/USDT chart is still valid, next uptrendHello my friends, today I want to talk with you about KCS.
Through my analysis as you can see It seems that the price run out of energy
As we can see, the volume the last month is in our area This means that there is strong support in this area
And the price can rebound from it to our frequency lines that I drew
so guys be ready for such scenario.
This is an article, not financial advice, always do your own research.
If you have any questions, you can write it in comments below, and I will answer them.
And please don't forget to support this idea with your like and comment, thank you.

Big Triangle on KCS/USDT chart is still valid, TRADING PLANHello my friends, today I want to talk with you about KCS.
Big triangle from previous idea is still valid.
At this moment price trades near support line of triangle.
And like btc is bullish now I think alts can suffering and KCS not an exception.
At first I'm waiting for next upward movement to resistance level 21 USD
After this if market will continue to be bullish I think KCS can break resistance at 21 and go higher.
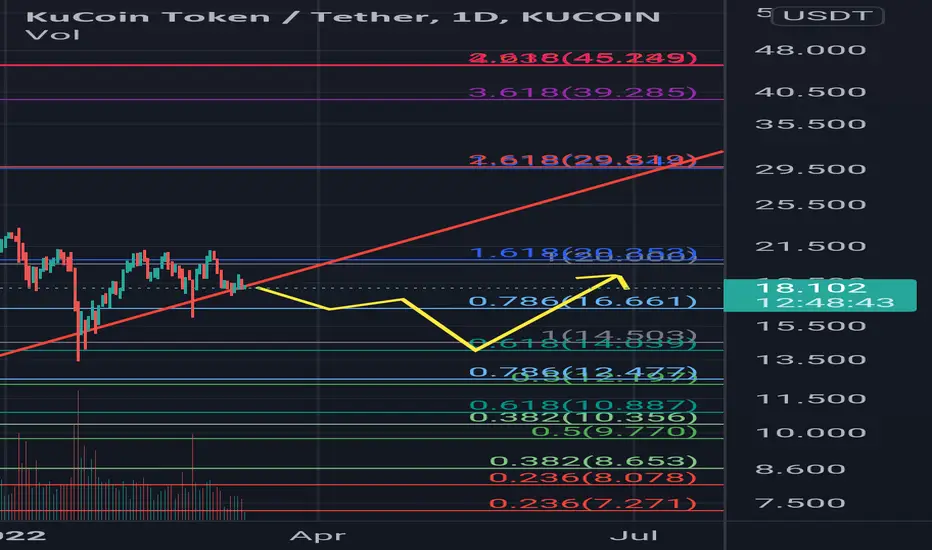
First target is can be 23.5 USD if price will break this resistance, this level also coincide with 1.618 Fibonacci level.
Second target is can be around 27-28 USD which is also coincide with 2.618 Fibonacci level.
So be ready for such scenario.
This is an article, not financial advice, always do your own research.
If you have any questions, you can write it in comments below, and I will answer them.
And please don't forget to support this idea with your like and comment, thank you.

KuCoin: Another Corrective Pattern Before The Big MovementKuCoin: Another Corrective Pattern Before The Big Movement
In fact, the price is close to a critical area as it is testing the top trend line of the "Wedge Pattern"
and the correction is getting bigger.
So we are in front of two possible scenarios.
Scenario 1:
The price can continue to move higher than it is now and may reach our targets.
Scenario 2:
The price can make a pullback before it moves above the resistance trend line.
For the current model, I am building my assumption based on the previous two models, that the model can be completed very quickly as an ABC wave correction.
The previous two bullish patterns highlighted in the chart were formed with ABC wave corrections.
Short Term Targets:
23.50
27.50
Medium-Term Targets:
32. 40
35.00
45.30
My long-term view on KCS is bullish and this is very strong crypto.
Thank you and Good Luck!

KCSUSDT Golden Cross, Resistance to beat & MojitoSwap investmentThe KuCoin Token traded within a Channel Up since it hit the Support Zone at the start of the week but that broke downwards with what looks like a Bull Flag. News-wise, with the announcement of a strategic investment with MojitoSwap, the price looks ready to jump. But let's see both the Technical and Fundamental sides in more detail.
** Technical Analysis **
As mentioned above, the pattern sequence on the 1H time-frame is a Channel Up into Bull Flag. When the dominant pattern is bullish and then pulls-back in the form of a Bull Flag, we should typically expect a strong rebound to a Higher High. The level to keep an eye on is the 19.180 Resistance made by the March 09 High. A closing above should be enough to kick start an aggressive rise towards the 21.230 - 21.000 Resistance Zone but on the other hand a rejection will most likely have the 17.530 Support re-tested.
Keep an eye on the Golden Cross that has just formed as last time it happened on 1H on February 26, KCSUSDT did test the 21.230 - 21.000 Resistance Zone. Also, straight after it was formed, KCS entered again a Bull Flag formation. So that pattern makes the current price action more bullish than bearish.
** Fundamental Analysis **
There can be no better price boost to this than the strategic investment from KuCoin Labs with MojitoSwap. The investment from KuCoin Labs will better assist MojitoSwap to improve its products, operations, branding and liquidity. In the future, MojitoSwap will gradually improve the liquidity mining mechanism, expand the support for NFTs, and strengthen the product experience to be more user-friendly. Meanwhile, MojitoSwap will also accelerate the support for native and cross-chain currencies on the KCC chain, with more projects to be launched on the MojitoSwap LaunchPad and Bar.
As a DEX at the bottom of the ecological foundation of the chain, MojitoSwap hopes to build a bridge between KuCoin and high-quality projects on the KCC chain, and jointly build a common prosperity on the chain.
This strategic investment has come perhaps at the right time and could be the extra push that the price needs right now to break above the 19.180. I don't believe these low prices will last for long on KCS and I am a big buyer myself. I suggest that you don't miss out on this opportunity either and get in now that it is still early.
--------------------------------------------------------------------------------------------------------
** Please support this idea with your likes and comments, it is the best way to keep it relevant and support me. **
--------------------------------------------------------------------------------------------------------

KCS - Purple War Zone!Hello everyone, if you like the idea, do not forget to support with a like and follow.
KCS is overall bullish trading inside our brown trendlines and now approaching the lower bound / trendline.
Moreover, the area 15.0-16.0 is a "Resistance turned into Support".
So the highlighted purple circle is a very strong area to look for buy setups as it is the intersection of support in green and lower brown trendline.
As per my trading style:
As KCS approaches the highlighted purple circle (area) I will be looking for possible buy setups (like a double bottom, trendline break, and so on...)
Always follow your trading plan regarding entry, risk management, and trade management.
Good luck!
All Strategies Are Good; If Managed Properly!
~Rich

KuCoin | Trading Within Structures | Beautiful Price DevelopmentWhat Is KuCoin Token (KCS)?
KCS is the native token of KuCoin, which was launched back in 2017 as a profit-sharing token that allows traders to draw value from the exchange. It was issued as an ERC-20 token running on the Ethereum network and was supported by most Ethereum wallets. The total supply of KCS was set at 200 million, and there is a planned buyback and burn until just 100 million KCS remain. Sooner or later, as the KuCoin decentralized trading solution goes live, KCS will be the native asset of KuCoin's decentralized financial services as well as the governance token of the KuCoin community in the future.
From the previous analysis, we can see the KCS is holding very strong close to our support area 17.6
We are already in profit with this trade approximately +4%.
For the time being, I am trading for the short-term target at 19 and 20.9 with very good potential profits as well.
As long as our support area at 17.6 showed its power a very good target will be the first structure zone at 19 and the next one
if the price will be more aggressive 20.9
The longer-term position that I am still holding on KuCoin si targeting a lot higher.
For that, you can refer to the "Base Analysis" as below.
Thank you and Good Luck!
Previous Analysis:
Base Analysis:

KuCoin token KCS global Overview and TargetsHello TradingView community and my subscribers, please if you like ideas do not forget to support it with your like and comment, thank you so much and we will start.
Today I want talk with you about KCS chart.
If we will take a look on big timeframes for example 1d.
We can see that kcs token trades in strong uptrend with some local corrections.
Thats why we see our global and local support lines.
At this moment price trades in accumulation zone in range 21-18 USD and I still think that price will continue to grow.
At first grow to top part of accumulation, resistance level 21 USD.
And after this possible continuing growing to 24 and 28 USD as main target.
So, I'm waiting for this scenario.
This is my opinion, I really hope this will be useful for you.
Be ready and take care your money. Have a great profit !

KCSUSDT is testing the 4h Support
The price had a nice breakout from the monthly support and retested it as new resistance. On the daily timeframe the price is creating a descending channel below the weekly resistance.
On the lower timeframe the price is testing the 4h support.
How to approach?
IF the price is going to lose the support, According to Plancton's strategy , we can set a nice order
–––––
Keep in mind.
🟣 Purple structure -> Monthly structure.
🔴 Red structure -> Weekly structure.
🔵 Blue structure -> Daily structure.
🟡 Yellow structure -> 4h structure.
–––––
Follow the Shrimp 🦐

🔥 KuCoin Token On Huge Support: Macro TroublesKCS has been one of the more stable tokens over the last couple of weeks. As of now, KCS is trading on a strong support area within a large wedge pattern.
With the macro outlook of the market looking unstable, there's a decent chance that the support will not hold. In that case, a move towards the January capitulation lows is to be expected.
However, we've got a FED rating announcement coming Wednesday. If we get a very bullish reaction, this could be the catalyst for the overall market trend to change. In that case, the top of the pattern will be the long-term target. Wait for confirmation before entering the trade.
Happy trading!

KCS - Video Top-Down AnalysisHello TradingView Family / Fellow Traders. This is Richard, as known as theSignalyst.
Here is a detailed update top-down analysis for KCS.
Which scenario do you think is more likely to happen? and Why?
Always follow your trading plan regarding entry, risk management, and trade management.
Good Luck!
All Strategies Are Good; If Managed Properly!
~Rich

KCS reaching the breaking pointKCS has been hitting a resistance since 16th of January but with time EMA 200 rose and price it's now enclosed between that and the resistance at 21.192 USDT. From a chart pattern point ov view this appears like a rising asymetrical triangle and even the fact that volume is decreaseing could be in line with a possible upcoming breakup which is a very good bullish pattern but overall indicators are uncertain.
I think you could start DCA if price hit lower support and bounce back OVER EMA 200, and despite this you should use a stop loss anyway considering the current market situation. Right now I wouldn't give anything for accounted.
If instead it breaks downwards you might look for shorting opportunities (I'll post some updates if I can).
Our number one rule now must be not risking anything and avoid to remain trapped with some bags (trust me I speak by personal experience).
Good luck
KCSUSDT:The Price is Kept firmly close To $ 18 | Bulls Next MoveWhat Is KuCoin Token (KCS)?
KCS is the native token of KuCoin, which was launched back in 2017 as a profit-sharing token that allows traders to draw value from the exchange. It was issued as an ERC-20 token running on the Ethereum network and was supported by most Ethereum wallets. The total supply of KCS was set at 200 million, and there is a planned buyback and burn until just 100 million KCS remain. Sooner or later, as the KuCoin decentralized trading solution goes live, KCS will be the native asset of KuCoin's decentralized financial services as well as the governance token of the KuCoin community in the future.
KuCoin: The price is kept firmly close to $ 18 | Bulls next move
Technical Analysis:
As we can see from our previous analysis the price increased in very fast steps from our
first and the strongest support area close to $18.
This trade is actually +6.3% in profit...not bad at wall for the time being
The first target should be approximately +16%...
The second target is +29.50%
Third target +56%
Probably this is the right time for the strong bullish wave that we were all
expecting to happen.
Thank you and Good Luck!
Base Analysis:

KCSUSDTKCSUSDT will see that the price is in a downtrend. If the price cannot break through the 18.63 resistance,
the price will return down to test the support frame 14.40 -15.43. Wait to buy the red zone. Target 21.05
GooD Luck 😊

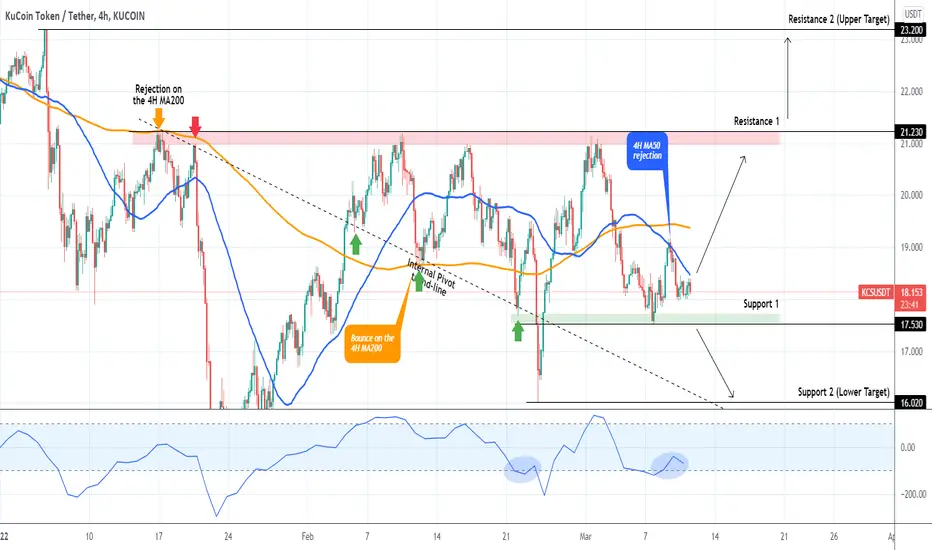
KCSUSDT Short-term approach around the 4H MA50The KuCoin Token got rejected early this month (March 01) on its Resistance Zone (1) that is holding since January 16th, practically almost 2 months. The symmetrical Support (1) held on March 07 but the rebound was short-lived as it got rejected on the 4H MA50 (blue trend-line).
In our opinion, this holds the key for the coin's immediate price action. If the 4H MA50 breaks, we expect another Resistance 1 test within 21.000 - 21.230. A 1D candle closing above it, would justify the test of the next Resistance (2) at 23.200.
On the other hand, a break below the 17.530 Support (1), would be a sell signal with the 16.020 Support (2) as the target.
So far the 1D CCI (indicator below the chart) is at the same levels of February 23. This also supports the above argument, as when 17.530 broke with the CCI collapsing to -200.00, KCSUSDT hit 16.020.
Keep also an eye on the Internal Pivot trend-line (dashed line) for a potential bounce, as it has bounced the price 5 times already since January 17.
--------------------------------------------------------------------------------------------------------
Please like, subscribe and share your ideas and charts with the community!
--------------------------------------------------------------------------------------------------------
KuCoin Token in Big Accumulation and soon can rise to resistanceHello TradingView community and my subscribers, please if you like ideas do not forget to support it with your like and comment, thank you so much and we will start.
Today I want talk with you about KCS chart.
As you can see price now trades in big accumulation in range 17.7-18.7.
Also you can see a resistance line.
When price will break this line price will go higher
And at first back to resistance level 21 USD.
Then we will see which will be a situation and I will publish an update for you.
So, I'm waiting for this scenario.
This is my opinion, I really hope this will be useful for you.
Be ready and take care your money. Have a great profit !

Big Triangle on KuCoin Token chart can push price to 23-28 USDHello my friends, today I want to talk with you about KCS.
Now KCS trades in big triangle.
Recently price bounced from support line of triangle and now trades in middle.
At first I'm waiting for next upward movement to resistance level 21 USD
Then price can create something like range and continue to grow.
First target is can be 23.5 USD and if price will break this resistance.
Then will go to second target around level 28 USD where is current ATH level.
So be ready for such scenario.
This is an article, not financial advice, always do your own research.
If you have any questions, you can write it in comments below, and I will answer them.
And please don't forget to support this idea with your like and comment, thank you.

KuCoin Price Analysis: Bulls Are Back In The GameWhat Is KuCoin Token (KCS)?
KCS is the native token of KuCoin, which was launched back in 2017 as a profit-sharing token that allows traders to draw value from the exchange. It was issued as an ERC-20 token running on the Ethereum network and was supported by most Ethereum wallets. The total supply of KCS was set at 200 million, and there is a planned buyback and burn until just 100 million KCS remain. Sooner or later, as the KuCoin decentralized trading solution goes live, KCS will be the native asset of KuCoin's decentralized financial services as well as the governance token of the KuCoin community in the future.
Technical Analysis:
As we can see from our previous analysis the price increased in very fast steps from our
first and the strongest support area close to $18.
This trade is actually +6.3% in profit...not bad at wall for the time being
The first target should be approximately +16%...
The second target is +29.50%
Third target +56%
Probably this is the right time for the strong bullish wave that we were all
expecting to happen.
Thank you and Good Luck!
Previous analysis:
Long Term Price Development:

KCS - Wait For The Trigger!KCS is overall bullish and currently sitting around a strong support so we will be looking for buy setups.
on H4: KCS is forming an inverse head and shoulders pattern but it is not ready to go yet.
Trigger => Waiting for the right shoulder to form and then buy after a momentum candle close above the gray neckline.
Meanwhile, until the buy is activated, KCS can still trade lower to test the green support again. In this case, we will be looking for new buy setups to form.
Good luck!
All Strategies Are Good; If Managed Properly!
~Rich
