KCSUSDT Inverse Head & Shoulders with 4H MA50/200 supportingThe KuCoin Token is maintaining its bullish sentiment after the January 22 market bottom as during this week's selling, the price found Support on the 1D MA100 (green trend-line) and is currently rebounding. If this holds, it will be an early bullish signal as with the 4H MA200 (orange trend-line) holding as well last week, KCS has formed an Inverse Head and Shoulders (IH&S) pattern. If the 21.205 Resistance breaks on this buying pressure, the technical target should be the 2.0 Fibonacci extension at 23.800.
Keep an eye on the MACD for a potential Bullish Cross that will confirm this break-out as when around the same level a MACD Bullish Cross took place, the price soared to +16.60% to the 21.205 Resistance. A +16.60% from a potential new Bullish Cross, will be exactly on the 23.800 2.0 Fib extension.
--------------------------------------------------------------------------------------------------------
** Please support this idea with your likes and comments, it is the best way to keep it relevant and support me. **
--------------------------------------------------------------------------------------------------------
KCSUSDT trade ideas

KCSUSDT: Update - The Bullish Momentum Is Still IntactFrom the previous analysis, the price is developing a bullish flag
close to the neckline. This is showing that the breakout of the bull flag
and also from the Neckline of the pattern will be very aggressive.
Also the price is moving inside a "Rising Channel"
We began this trade when we anticipated the wedge pattern as shown on the idea below.
The trade was initiated at $16.5 and we close +20% profits for the CD leg of the harmonic pattern (idea below).
The first target was reached at $20.
After a small correction now the price is creating an "Inverse Head & Shoulder" Pattern.
Once the price breaks out above the neckline or 21.15, we will see it rise higher.
Short Term Targets:
23.50
27.50
Medium-Term Targets:
32. 40
35.00
45.30
Thank you!
We booked here +20%
Previous idea:

KCS TOKEN BULL RUN 2022KCS TOKEN looking extremely bullish.
One of the better exchanges around, if you haven't checked them out you should.
What Is KuCoin Token (KCS)?
SOURCE* coinmarketcap.com
What Makes KuCoin Token Unique?
KCS Bonus is regarded as one of the best ways to get passive income. Users who hold more than 6 KCS can get a daily dividend, which comes from 50% of KuCoin's daily trading fee revenue. KCS Bonus is a unique incentive mechanism for KCS holders and KuCoin ecosystem builders. The amount of rewards that users can get depends on the number of KCS held and the trading volume of the KuCoin Exchange.
Big 4hr candle close for the market as a whole today as we try and find support at the 200 ema, keep an eye on your total market caps and market leaders, btc, eth, etc.
DYOR
GOOD LUCK

KCS Inverse H&S on the Daily...KCS is KuCoin's native token like BNB is to Binance, albeit BNB is $430. I'm not a fan of longing hard any asset in this current climate but this can be an outlier if it takes out resistance at the $21 area. Pro Blue Osc has moved above the zero line, RSI and MACD Bullish as well. An entry above $21 should prove to be a good trade if market climate cooperates.

🔥 KuCoin Token Higher Low Set: Ready For Take OffAs you might have seen in my previous analyses, I've been following KCS's bullish correction every step of the way.
With the big reversal over the last 24 hours, I think that the higher low has definitely been set and that more bullish price action is coming our way.
In my previous analysis I marked the $21.2 area as an area of resistance. This was also the exact area where the minor bearish correction occurred a couple of days ago. For now, my previous set targets are still in place.
Assuming BTC will remain either neutral or slightly bullish, good things will come our way.
Happy trading!

KCSUSDT: The Pattern Continues To Confirm The Bullish MomentumWe began this trade when we anticipated the wedge pattern as showed on the idea below.
The trade was initiated at $16.5 and we close +20% profits for the CD leg of the harmonic pattern (idea below).
First target was reached at $20.
After a small correction now the price is creating an "Inverse Head & Shoulder" Pattern.
Once the price breaks out above the neckline or 21.15, we will see it rise higher.
Short Term Targets:
23.50
27.50
Medium Term Targets:
32. 40
35.00
45.30
Thank you!
We booked here +20%
The base scenario for the actual price development:

KuCoin Token (KCS) | Multiple TimeframesKucoin Token vs Tether (KCSUSDT) has an interesting chart.
We will be looking at multiple timeframes.
Let's start with the monthly...
Here we can see KCSUSDT in a strong uptrend starting January 2021. That's over a year of continued growth.
The first peak happened in April 2021 and then a new high just shy of the previous one in November/December 2021, basically the same as Bitcoin.
The trading volume has been declining ever since January 2021, this can be considered a continuation signal on this chart or a distribution phase.
KCUSDT monthly stays bullish above EMA10 or $15.8.
Below this level we will see a test of lower support around $11.11 or EMA21.
In general, the technicals are bullish but near resistance/high prices, corrections can develop at anytime.
Now the weekly timeframe to get more in-depth information:
The pattern we are seeing can break either way and is a consolidation pattern.
EMA50 is working as support on this timeframe and has been tested three times, this coincides with the rising trend-line.
You can find the potential targets and support levels on this chart.
To finish, the daily timeframe makes it clear that we are in a decision point:
KCSUSDT is trying to resume its rally but this is not confirmed until prices move and close above $23.5... Trading below this level can increase the risk of a sudden drop.
The longer KCSUSDT remains below the last high, the higher the chances that it will correct before additional growth.
I would be really cautious on this one until a clear buy setup shows up.
Thank you for reading.
This is not financial advice.
I am just reading the charts.
Namaste.

Kucoin token is creating a wedge Kucoin token is creating a wedge pattern. Wait for the breakout. The direction of the breakout will show the next token trend

KCS - Trend-Following Buy Setup!Hello everyone, if you like the idea, do not forget to support with a like and follow.
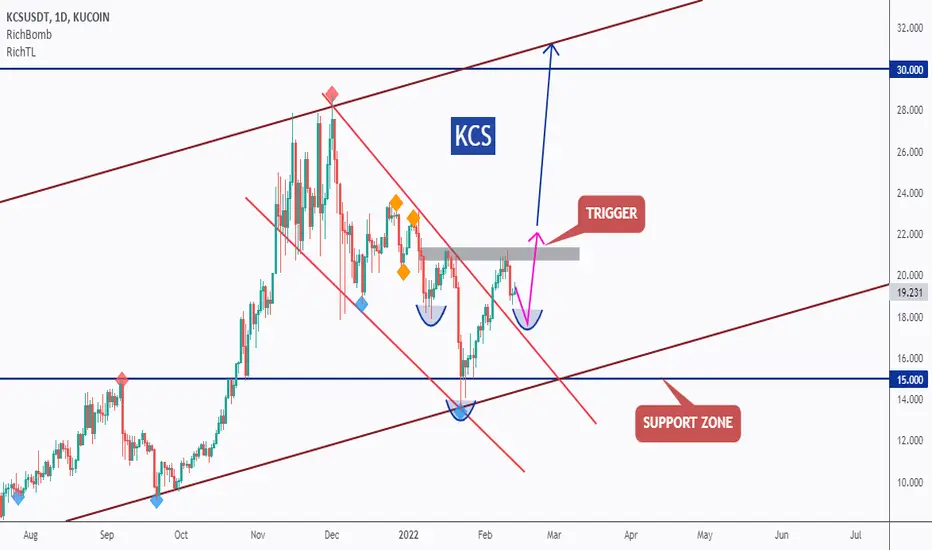
KCS is overall bullish and now approaching a strong support zone in blue (15) so we will be looking for buy setups.
on DAILY: KCS is forming an inverse head and shoulders pattern , but it is still an idea.
Trigger => Waiting for the right shoulder to form then buy after a momentum candle close above the gray neckline.
Meanwhile, until the buy is activated, KCS would be overall bearish from a medium-term perspective and can still dive inside the support zone before going up.
Good luck!
All Strategies Are Good; If Managed Properly!
~Rich
KCSUSDT above its 1D MA50 again. Potential rally ahead.The KuCoin Token broke and closed above its 1D MA50 (blue trend-line) this week for the first time since December 23. Technically the period from December 09 2021 until February 07 2022, was the new Accumulation Phase, which since May, it has been a regular formation (May 13 - July 04 and September 10 - October 13). Basically those consolidation phases have been taking place roughly within the 1D MA50 and the 1D MA200 (orange trend-line) inside the broader pattern of a Channel Up.
Once KCSUSDT closed the first 1D candle above the 1D MA50, the price rallied to the top (Higher Highs trend-line) of the Channel Up, either very aggressively or on a more sustainable fashion. Since on February 07 the price closed a 1D candle above the 1D MA50, we can expect a new rally to start. Taken by the fact thought that it is already 5 days above the 1D MA50 and is consolidating, as well as the fact that this time the Accumulation Phase has been the longest, I estimate that the new Rally Phase won't be a fast one but rather slow and structured. A rough projection puts the new Higher High within $40.00 - $48.00 just below the 2.0 Fibonacci extension of the long-term Fibonacci Channel.
--------------------------------------------------------------------------------------------------------
** Please support this idea with your likes and comments, it is the best way to keep it relevant and support me. **
--------------------------------------------------------------------------------------------------------

KCS 1D Step-by-step long-term investment #8We continue to publish a weekly column on public investing in Kucoin token
Why we chose this particular token you can read in our previous ideas for this section using the KCSUSDT ticker search
Today the position shows +15%, but we do not fix this profit because it is a long-term investment.
Also, the stop on the position is still unchanged - $14.24 , because there is a possibility of price correction on the chart of BTCUSDT
It is very likely that there will also be a price correction on the KCSUSD chart.
If the correction will not be lower than $17.66 , then, firstly, it will indicate the super strength of the buyer and accordingly the prospects of a strong growth trend in the future. In that case, the take profit target will be shifted to $42.8.
Secondly, it will be a very tasty bargain for those who didn't manage to buy KCS.
If the correction goes lower than $17.66, but within the growth channel, that is - roughly speaking - higher than $15, then the fixation target for the long position will be about $34 for 1 KCS.
By the way, we drew a dynamic fibo growth channel on the chart, so that it was more clearly visible how the price moves up, taking into account the dynamic support and resistance levels.
_______________________________
Since 2016 , we have been analyzing and trading the cryptocurrency market.
We transform our knowledge, trading moods and experience into ideas. Each "like under the idea" boosts the level of our happiness by 0.05%. If we help you to be calmer and richer — help us to be happier :)

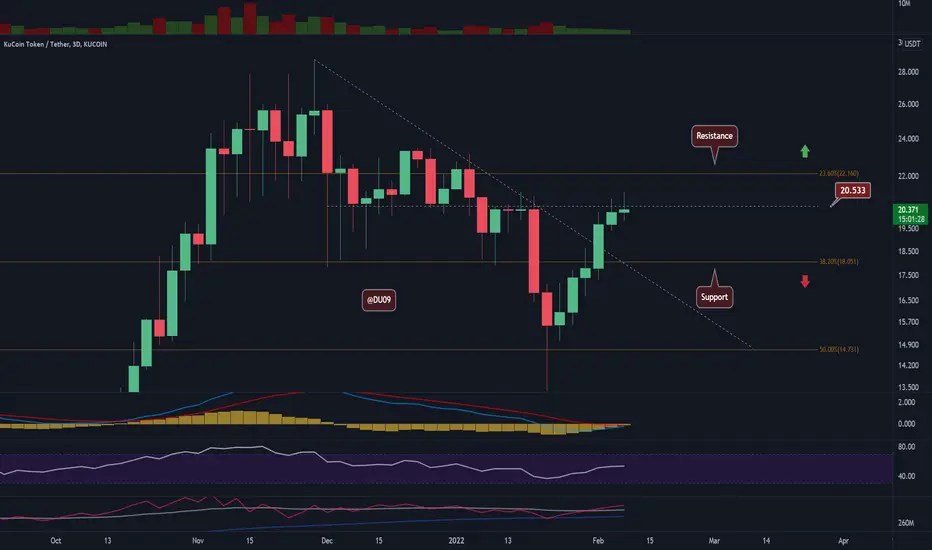
KCS/USD - KCS Facing Resistance at $20! Can it push through? 🧐After breaking above $18, KCS rallied nicely all the way to $20 where it now faces some steep resistance. Momentum is building up and KCS may attempt a break in the future if the overall market allows it.
Key support: $18
Key resistance: $20, $22
KCS rallied over 10% after breaking above $18 to reach the key resistance at $20. Now, market forces are fighting at this key level before the winner will decide where the price is headed next.
If the bulls are successful, then the price will likely go to $22 where we find another key resistance as indicated on the chart. If the bears win, then KCS may fall back to the $18 support level.
Watch closely BTC and ETH as they will also influence where the market is headed next and KCS too.
Technical Indicators:
Volume: Volume has been steady, but declining somewhat. Nevertheless, all 3-day candles closed in the green in the past 20 days which is impressive. Perhaps a pullback is expected due to this.
RSI: The daily RSI is curving down after the price failed to move above $20. For this reason, do not exclude a pullback and a shallow correction in the future.
MACD: The daily MACD is bullish, but the histogram is quickly losing momentum with lower highs. Unlikely for KCS to move above $20 in this context.
Bias
The bias for KCS is neutral. KCS lost some of its momentum and we could see a pullback.
Short-Term Price Prediction for KCS
If KCS enters a correction, then the price may fall to $18 before a renewed push higher can be had. For now, watch closely the price action at $20 to get a hint of where the price is headed next.
Like and follow if you liked my idea!
KCS - 30.0 see you soon!Hello everyone, if you like the idea, do not forget to support with a like and follow.
Here is the top-down analysis for KCS, feel free to request any pair/instrument or ask any questions in the comment section below.
Best of luck!


KCSUSDT is trying to have a breakoutThe market had a breakout from the weekly resistance and retested as new support on the 0.786 Fibonacci level, and the price respected the dynamic weekly resistance.
On the daily timeframe the price is creating a descending channel on the weekly structures, and the price is trying to have a breakout from the descending channel and daily resistance.
On the 4 Timeframe, the price is creating an ascending channel inside the main descending channel.
How to approach?
IF the price is going to have a breakout from the daily and descending resistance, According to Plancton's strategy , we can set a nice order
–––––
Keep in mind.
🟣 Purple structure -> Monthly structure.
🔴 Red structure -> Weekly structure.
🔵 Blue structure -> Daily structure.
🟡 Yellow structure -> 4h structure.
–––––
Follow the Shrimp 🦐

🔥 KuCoin Token Front-Running The MarketAround a week ago I made an analysis on KCS and the huge rebound it was seeing. After a minor dip outside of the initial channel, KCS has seen further strength and broke though the resistance with a massive bullish candle. KCS is currently front-running the market, which could signal that lagging coins will soon be picking up speed and see stronger gains.
For now, nothing seems to be able to stop KCS. I'm seeing this token reach the second target within the next two weeks, assuming that the trend will continue.
Happy trading!

KCSUSDT: The Price Continues To Confirm The Upward MovementFrom the previous analysis, we closed +20% profit on KuCoin for the short-term target.
It moved really well. Now I am again focused on long-term trading.
Bitcoin is changing the movement and it looks like the bearish movement it's over.
So this will turn everything on the road again.
KuCoin on the other hand keeps confirming the bullish pattern that are in line with it's own forecast.
On the previous pattern, we were trading the CD leg of the pattern.
That CD leg corresponded with the breakout of the "Falling Wedge". I saw that combination a bit late to be honest.
Actually, the bullish movement looks very beautiful and promising because the price is already outside of the "Falling wedge" Pattern
and this is increasing the chances on our side of trading.
Thank you and Good Luck!
Previous analysis:
The +20% Pattern:

KCS/USDT: Price Can Reach $20 This Week | +17% Potential ProfitFrom the previous analysis, we opened our trades at 16.50
So we should be approximately +3.5 to +4%
Seen from a long-term perspective the price should continue moving a lot higher.
I am focused on this short-term trade for the time being.
This outlook is in line with the CD leg completion of the Harmonic pattern.
With this, I am targeting a profit of +17% now and as +21% from my original entry zone.
Target: $20
KCS is a coin that I have got several times very good profits.
They are all shared in the analysis below.
For a longer-term investment refer to the "Related Ideas" as below.
I am trading KCS in the short term and Long Term Investment.
Thank you and Good Luck!
Previous Idea:

KuCoin : The Bullish Wave Keeps Developing Very WellKuCoin Price Analysis: The Bullish Wave Keeps Developing Very Well
From the previous two analyses, we opened our trades at 16.50
Actually, the price is at 18.5 and we are +12% on this trade.
Seen from a long-term perspective the price should continue moving a lot higher.
I am focused on this short-term trade for the time being.
The price keeps developing the CD leg of the pattern.
During this movement, we can see that it completed two small bullish flags.
Target: $20
KCS is a coin that I have got several times very good profits.
They are all shared in the analysis below.
For a longer-term investment refer to the "Related Ideas" as below.
I am trading KCS in the short term and Long Term Investment.
Thank you and Good Luck!
Entry Price Idea:
The second idea that is actually developing:

KCS/USD - KuCoin Token Breakout! $22 Next!After finding support on the $15 level, KuCoin Token (KCS) rallied and used the bullish momentum to break above $18. This puts KCS on a clear path towards $22.
Key support: $18
Key resistance: $22
With this latest breakout, KCS has made the $18 level support and is likely to continue higher until the key resistance at $22.
This latest breakout has put a stop to the downtrend and if KCS is successful in moving above $22, then the correction that started in December 2021 would be put to an end.
Nevertheless, breaking above $22 seems a difficult talks for KCS. Best to be patient and also monitor the overall market.
Technical Indicators:
Volume: Volume spiked last Friday during the breakout above $18 and buyers are still in total control of the price action. As KCS approaches the key resistance at $22, selling and profit taking may intensify which may lead KCS into a pullback.
RSI: The daily RSI made a higher high and is above 50 points. There is plenty of space left until the RSI reaches the overbought zone.
MACD: The daily MACD remains bullish and the histogram continues to move higher with momentum on the buyers side. If this is sustained, KCS can easily reach $22 in the nearby future.
Bias
The bias for KCS is bullish.
Short-Term Price Prediction for KCS
As long as bulls can maintain the current momentum, KCS is well positioned test the key resistance at $22. However, good to be cautious as price moves higher since bears may attempt to push back on this latest rally.
Like and follow if you liked my idea!

KCSUSDT- KUCOIN One of the best keep secret exchange coins. I've been in this for the long term since $9.12 but its been move upwards..

KCS 1D Step-by-step long-term investment #7We continue to publish a weekly column on public investing in Kucoin token
Why we chose this particular token you can read in our previous ideas for this section using the KCSUSDT ticker search
A week ago we have three orders opened, and now we have a long-term position with notional $900 with an average entry price of $17.66. At that time, the position was still loss-making, and we did not place a stop due to high volatility in the market.
Today the position shows +5%, and we can already put a logical stop on the position.
As can be seen on the chart, we have a trade with the following conditions:
Entry = $17.66.
Stop = $14.24
Take Profit 1 = $36
Profit/loss ratio = 5/1
On the one hand, you can say that the stop is large, perhaps, but the ratio of potential profit to loss is acceptable for a long-term investment, and we do not want to lose a position at a nice price.
In the same way we will manage the position in the course of price growth: rearrange the stop, fix profit on the part of the position, etc. If this is interesting for you, in order not to miss the update, subscribe to us, give us your likes and comments, and then tradingview will be the first to inform you about changes.
_______________________________
Since 2016 , we have been analyzing and trading the cryptocurrency market.
We transform our knowledge, trading moods and experience into ideas. Each "like under the idea" boosts the level of our happiness by 0.05%. If we help you to be calmer and richer — help us to be happier :)

Interesting two parallel channelHello everyone
Before we start a discussion, it is my pleasure to read your opinion on this post's comment section and support this idea with your likes if you enjoyed it!
KCSUSDT :
A big channel and a smaller parallel channel can be seen.
The price reached the upper line of the bigger channel and then reacted to the line and reversed.
At the same time, we see the price braked the small parallel channel and this is a trigger for a bearish wave to the lower line of the bigger channel.
Now, a pullback is seen to the smaller channel and it is a good opportunity to go short.
The target is the lower line of the bigger channel.
