KCSUSDT Price Analysis: Moment Of The Truth | Possible BreakoutFrom the previous analysis, the price increased by + 11%.
So what can happen now?
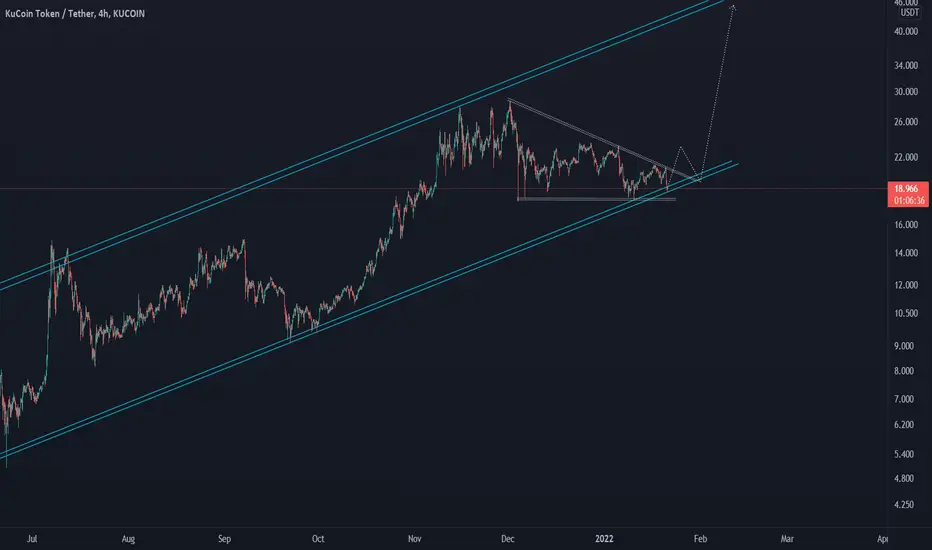
In fact, the price is close to a critical area as it is testing the top trend line of the "Wedge Pattern"
So we are in front of two possible scenarios.
Scenario 1:
The price can continue to move higher than it is now and may reach our targets.
Scenario 2:
The price can make a pullback before it moves above the resistance trend line.
For the current model, I am building my assumption based on the previous two models, that the model can be completed very quickly as an ABC wave correction.
The previous two bullish patterns highlighted in the chart were formed with ABC wave corrections.
Short Term Targets:
23.50
27.50
Medium Term Targets:
32. 40
35.00
45.30
Thank you and Good Luck!
Key Information:
KCS is the native token of KuCoin, which was launched back in 2017 as a utility token that allows traders to share the growth benefit of the exchange.
The total supply of KCS was set at 200 million, and there is a planned buyback and burn until just 100 million KCS remain.
KCSUSDT trade ideas
KCS down trendThere was glitch on pervious post, that why I re-posted this analysis .
KCS has met its AHT on Dec. 01. 2021 $28.70s from which it started its bearish trend KCS has reacted to its down trend several times up to now on following dates and prices:
1) Dec 27 2021, reacted to $23.70s
2) Jan 05 2022, reacted to $22.05s
3) Jan 16 & 17 2022, reacted to $21. 15s
4) Jan 20 2022, reacted to $20.90s
5) and now today, Feb 02 2022, reacted to $18.15s.
Should KCS not be able to break this cluster if levels, it may crash down to $14.80s - $13.50s
support level.
This is personal idea and I am not a financial adviser

KCS dow trendKCS has met its AHT on Dec. 01. 2021 from which it started its bearish trend KCS has reacted to its down trend several times up to now on following dates and prices:
1) Dec 27 2021, reacted to $23.70s
2) Jan 05 2022, reacted to $22.05s
3) Jan 16 & 17 2022, reacted to $21. 15s
4) Jan 20 2022, reacted to $20.90s
5) and now today, Feb 02 2022, reacted to $18.15s.
Should KCS not be able to break this cluster if levels, it may crash down to $14.80s - $1350s again.
This is personal idea and I am not a financial adviser

🔥 KCS Incredible Strength: Potential Break Out SoonA couple of days ago I made an analysis on KCS and its strong upward momentum.
As seen on the chart, KCS followed my pattern almost to the letter, with more bullish price action coming to it as we speak. The bullish trend line still holds strong, so we could re-test it again in the coming days.
However, the most likely scenario in my opinion would be a bullish move towards the top resistance. I'm expecting heavy volatility around the yellow area. We will either reverse from there to re-test the bullish trend line, or we break out and will re-test the resistance later.
Happy trading!

KCSUSDT is creating a descending channelThe price is going to retest the previous resistance as new support on the 0.786 Fibonacci level.
We can see how the price is testing the dynamic support and static support on the weekly timeframe.
On the daily timeframe, the market is creating a descending channel.
Usually, we avoid opening a short position above the weekly structures, for that reason we are monitoring for a new inverse movement
How to Approach?
IF the price is going to have a breakout from the descending channel and weekly resistance, we can add to our watchlist and wait for applying our rules.
It's not enough to see a breakout from the descending channel, you need to have a stratey.
–––––
Follow the Shrimp 🦐
Keep in mind.
🟣 Purple structure -> Monthly structure.
🔴 Red structure -> Weekly structure.
🔵 Blue structure -> Daily structure.
🟡 Yellow structure -> 4h structure.

KCS all 3 possible moves hello everybody
these are 3 possible moves
green : squeezing price below the trendline and breaking it. ( personally, I will wait for 18 $ resistance to break ) ( don't forget to wait for retest).
yellow : relow at 15 $ support line then break the trendline. ( I will buy after retesting the trend )
red : losing the 15 $ support and retesting it.
......
this is another trade for now and a little risky.
the first target is touching the trend
sec target losing the trend and it is 15 $
not financial advice.
goodluck

🔥 KuCoin Token Reversal: Higher LowsKCS is one of the few tokens which has succeeded into printing consecutive higher lows since the liquidation cascade of January 22nd.
As seen on the chart, there's a clear dynamic support which causes continuous bounces.
I'm expecting the price to pull back towards the trend line in the coming days. In that case, it would be a very decent short term trade. This assumes that BTC will remain stable at the very least.
Happy trading!

KCS/USD - KuCoin Token Rallies 20% After Finding Support at $15!After a significant market drawdown, KuCoin Token has finally found a good level of support that can propel the price back on the uptrend.
Key support: $15
Key resistance: $18
After a significant drop in early January, KCS has found good support at $15. So far this key support held strong and allowed the price to recover some of the losses with a nice 20% price increase in the past week.
This puts KCS back on the uptrend. The first real challenge for buyers will be the $18 key resistance level that will be difficult to crack, particularly if the overall market remains bearish.
Technical Indicators:
Volume: After a spike in volume during the most recent sell-off, the price entered into an uptrend, albeit on a lower volume profile. So far the bulls managed to have the upper hand, but this will be tested once the price arrives at resistance.
RSI: The daily RSI fell into the oversold area during the crash last Saturday. Since then, the RSI rallied and is found at 36 points.
MACD: The daily MACD remains bearish, but the histogram and moving averages are quickly curving back up. If buyers can sustain this momentum, they have a good chance to flip MACD back on the positive side.
Bias
The bias for KCS is mildly bullish. However, it is important to be cautious, particularly as the price approaches the key resistance at $18.
Short-Term Price Prediction for KCS
If the current bullish momentum is maintained, then KCS has a good chance to test the key resistance at $18. It is too early to tell if buyers will be able to move higher than that. I will revisit the chart once that happens.
Like and follow if you liked my idea!

KCS 1D Step-by-step long-term investment #6We continue to publish a weekly column on public investing in Kucoin token
Why we chose this particular token you can read in our previous ideas for this section using the KCSUSDT ticker search
1-2 weeks ago we were placing 3 buckets orders to buy long.
On the recent crypto market fall, we got all buy orders filled.
Now we have position with notional 900$ with average entry price $17.66 Logical stop below $15, however we do not place it yet, because the market is very volatile now, it is a pity to lose a long term position gained at a delicious price.
As soon as the market shows a clear trend, we will place a stop and either update this idea, or we will write about it in a new idea.
So, in order not to miss an update, subscribe to us, like and comment, and then you will be the first to be notified about the changes by tradingview.
Today we will look at the KCSUSD pair on the 3D time frame. This is the third 3D candle in a row trading above the strong mirror level of $15 . It looks like that level was tested from above and now the buyers are fixing the KCS price above it.
So far, everything is done in order for the growth to start in the near future.
The first growth target is around $36 , which is x2 from our buying point, and it might be just the middle of the big growth channel.
The global target for growth unchanged is $100-110. We would like to bring this column to the target and fix the profit with you.
_______________________________
Since 2016 , we have been analyzing and trading the cryptocurrency market.
We transform our knowledge, trading moods and experience into ideas. Each "like under the idea" boosts the level of our happiness by 0.05%. If we help you to be calmer and richer — help us to be happier :)

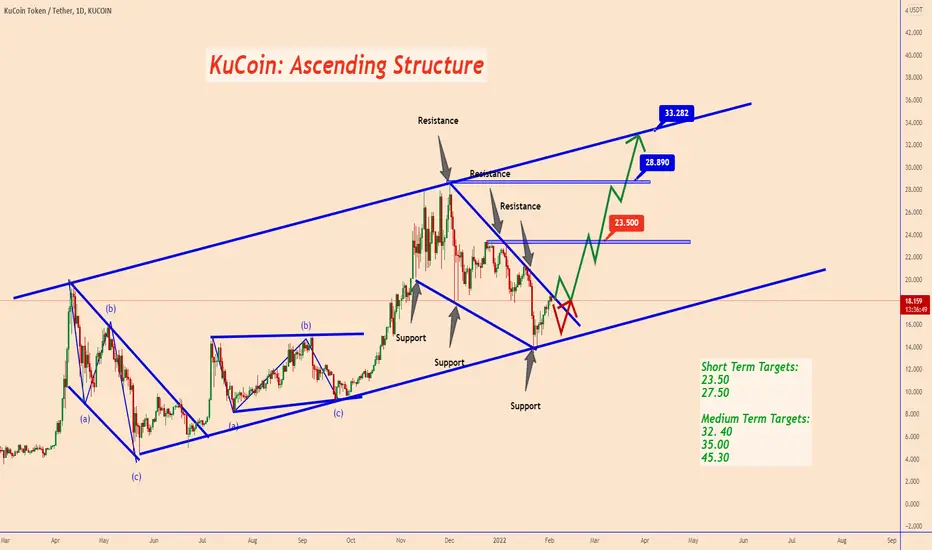
KCSUSDT: Ascending Structure In Development | BUY LOWKCS looks like it completed an ABC correction movement after BTC made that deep correction at 32K.
Now we can see it moving higher very soon. Also, the price made a deep pullback that ended close to 78.6% fib. retracement.
A breakout of the price above the wedge pattern would confirm a fast increase in the bullish momentum.
The first wave movement that I am looking at is the same as the one located on June 21.
On the other hand, if that "Wedge Pattern" will prove to be correct then we can see the price moving higher and complete the "Ascending Channel"
For more details check the "Related Ideas"
Short Term Targets:
23.50
27.50
Medium Term Targets:
32. 40
35.00
45.30
Thank you!

KCS - My Trading Plan in a video!Hello everyone, if you like the idea, do not forget to support with a like and follow.
Here is the top-down analysis for KCS, feel free to request any pair/instrument or ask any questions in the comment section below.
Best of luck!

KCS - Let's Go!Hello everyone, if you like the idea, do not forget to support with a like and follow.
KCS is overall bullish trading inside the brown channel.
KCS is now approaching the lower brown trendline and 15.0 horizontal support in green, so we will be looking for buy setups.
Before buy, we want the bulls to take over by breaking above the previous major high.
on DAILY: KCS is forming a trendline in blue but it is not valid yet, so we are waiting for a new swing high to form around it to consider it our trigger swing. (projection in purple)
Trigger => Waiting for that swing to form and then buy after a momentum candle close above it (gray zone)
Meanwhile, until the buy is activated , KCS would be overall bearish from a medium-term perspective and can still trade lower.
Good luck!
All Strategies Are Good; If Managed Properly!
~Rich

KCS/USD - Market Crash, Where Next for KuCoin Token? 😪The crash this week has pushed KCS to $13 for a brief moment. Now, the key level at $15 is being contested by bulls and bears. The winner will decide where KCS is headed next.
Key support: $11
Key resistance: $18
January has been a very difficult month for KuCoin Token, losing over 40% of its valuation. The bears took full control of the price action, leading to a major crash.
KCS has found some relief at the $15 level. However, if bears continue their assault, then likely for price to drop to $11 which should act as support. The resistance sits at $18 and appears unlikely to be tested any time soon.
Technical Indicators:
Volume: The drop took place on increasing volume. This is a sign of strength for sellers.
RSI: The daily RSI is in the oversold area at 25 points. A bounce could be expected since price rarely sits in extremes for long.
MACD: The daily MACD is bearish and this most recent price action has pushed the moving averages and histogram to make lower lows.
Bias
The bias for KCS is bearish. The indicators as well as the price action shows that the sellers have the upper hand.
Short-Term Price Prediction for KCS
Considering the market right now, it is best to be patient and let KCS find a good level of support that can stop the price fall. The support at $11 is good candidate for that.
Like and follow if you liked my idea!

KCS ZoneI am somehow KCS lover!! but for now, we should seek the good zone to rebuy it. I think 15-17 is a good choice to rebuy for 50 dollar target!!! we should come back for broke everything hardly. We are in crypto. so every chart gives us the opportunity. This would be our last time

KCSUSDT is testing the daily resistancethe price created a double bottom on the weekly support (the red one) on the 0.5 Fibonacci level.
After the breakout, retested the previous resistance as new support (on 4h timeframe)
The price got a rejection from the daily resistance and 4h dynamic resistance.
How to approach?
IF the price is going to have a breakout from the dynamic resistance and daily resistance with volume, we can add in our watchlist and wait to apply our rules in order to find a new long opportunity.
–––––
Follow the Shrimp 🦐
Keep in mind.
🟣 Purple structure -> Monthly structure.
🔴 Red structure -> Weekly structure.
🔵 Blue structure -> Daily structure.
🟡 Yellow structure -> 4h structure.

kucoin(KCS)KUCOIN is at the bottom of its own ascent channel. It grows sharply in the same canal and corrects in the form of erosion
Erosion correction with a low slope reaches the bottom of its channel in the form of a wedge pattern
Which, in my opinion, can cause the chart to be thrown to the ceiling of its own channel.
KCS 1D Step-by-step long-term investment #5We continue to publish a weekly column on public investing in Kucoin token
Why we chose this particular token you can read in our previous ideas for this section using the KCSUSDT ticker search
A week ago, we placed 3 buckets of buy orders to go long.
Tonight, on a strong next crypto market drain, only the first order to buy 1/3 of the position at $18.81 worked.
An interesting fact is that at the time when the price of BTCUSDT and prices of many alts update their lows of the last months, the price of KCSUSD is confidently held by buyers. This is good news, because where are the strong and confident buyers we can less afraid of considering a long-term investment, because the chance that after the next pump the price of the alt is sold at -80% is much lower.
Also, what can be the next move of price KCSUSDT adds more intrigue to us the KCSBTC chart
The consolidation spring is severely compressed and there will be a powerful impulse soon.
If it is down by -15-16%, it is very likely to fill our 2 at $17.66 and 3 at $16.51 long-term long buy orders.
However, from past experience such patterns usually shoot upwards. The percentage strength of possible upward impulses is depicted on the chart.
If we see that the sellers have run out of steam and the KCS price starts to shoot up, we will buy 2/3 of the position at the market price and update this idea.
So if you are interested in this section, subscribe to us and write a comment under this idea, and then tradingview will be the first to notify you of any changes and corrections in this section.
_______________________________
Since 2016 , we have been analyzing and trading the cryptocurrency market.
We transform our knowledge, trading moods and experience into ideas. Each "like under the idea" boosts the level of our happiness by 0.05%. If we help you to be calmer and richer — help us to be happier :)

🔥 Kucoin Token: Break Out Or Bearish Continuation?A week ago I made an analysis on KCS and the bearish triangle it was trading in.
As expected, KCS is still trading inside this triangle pattern. However, during BTC's massive impulse wave earlier today, KCS saw a big move towards the triangle's top resistance area.
If BTC is able to maintain the bullish trend, we can expect KCS to break out in the near future. However, with a more bearish market we're going to move down towards the triangle's support again. Keep a close eye on BTC.
Happy trading!


What do you think about Kucoin Token?Please share your idea for increasing the analyze .
I believe that if the Kucoin burn tokens it will grow fast to its targets.
You can see the waiting steps in this chart

KCS#crypto #bitcoin #cryptocurrency #blockchain #ethereum #btc #forex #trading #money #cryptotrading #bitcoinmining #cryptonews #cryptocurrencies #investing #investment #bitcoinnews #bitcoins #eth #invest #business #entrepreneur #forextrader #bitcointrading #binance #trader #investor #nft #litecoin #bitcoincash #bhfyp

KCSUSDT is creating a range on the 0.618 Fibonacci LevelKCSUSDT is creating a range on the 0.618 Fibonacci Level above the weekly support.
IF the price is going to have a breakout, According to Plancton's strategy (check our Academy ), we can set a nice order
–––––
Follow the Shrimp 🦐
Keep in mind.
🟣 Purple structure -> Monthly structure.
🔴 Red structure -> Weekly structure.
🔵 Blue structure -> Daily structure.
🟡 Yellow structure -> 4h structure.
⚫️ Black structure -> <4h structure.

🔥 KuCoin Token Volatility ExpectedSince the drop earlier in November, KCS has been following Bitcoin and has been trading bearish. During this period, the price has formed a descending triangle on the chart.
Descending triangles are classically bearish trading patterns, so a bearish break out of this pattern is more likely than a bullish one.
For the coming weeks, I'm expecting the price to follow the pattern. Somewhere late January / early February we can expect a big move, since the price has reached the end of the pattern.
Keep a close eye on Bitcoin. Bearish BTC will most likely signal a bearish break out, and the other way around.
Happy trading!
