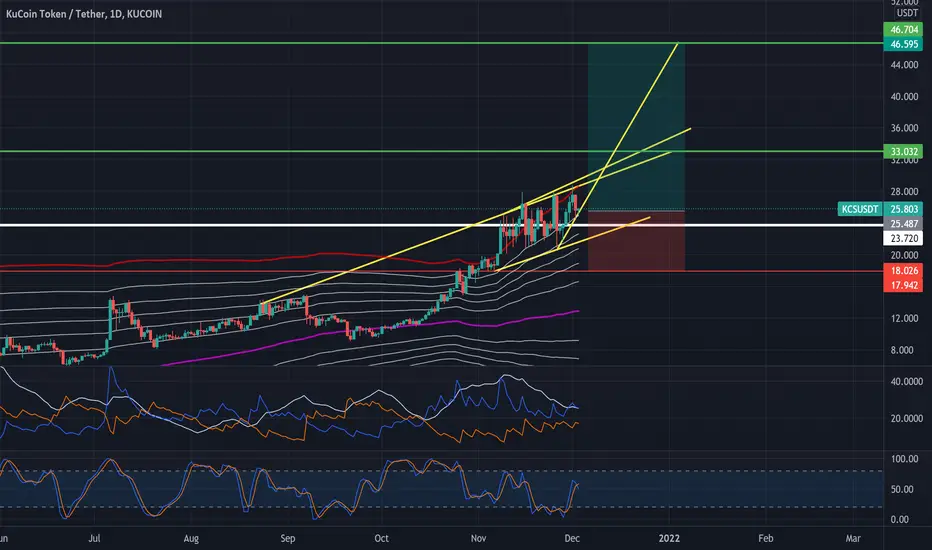
KCS; showcase of strenghtIn previous dip of the market KCS did managed to stop at 17.9 and quickly recovered to 22.
Due to upward trend in the charts and potential for a massive parabolic move:
Entry: 22
SL: 20
TP1: 27
TP2: 33
KCSUSDT trade ideas

KUCOIN made a MACD Bullish Cross. Quick buy opportunity.KCSUSDT survived last week's crash with a Double Bottom, creating a Support Zone within 17.900 - 18.100. However the MA200 on the 4H time-frame (orange trend-line), has rejected the rebound so far and is posing as the new Resistance. That is a trend-line that was previously the Support of the uptrend since October, so it is critical to break if KuCoin is to see another sustainable rally. Basically this can be used as a confirmation break-out signal.
That may be a good buy opportunity on the short-term as since October 13, every time the MACD made a Bullish Cross, with the CCI indicator (all on the 4H time-frame of course) on Higher Lows after the price made a Support, KCS rallied with each rise varying 14% to 44%. Naturally, once the new technical Resistance set by the 4H MA200 breaks, short-term traders may target 25.300, 27.700 and 30.000 in succession.
Don't miss this unique buy opportunity!
--------------------------------------------------------------------------------------------------------
** Please support this idea with your likes and comments, it is the best way to keep it relevant and support me. **
--------------------------------------------------------------------------------------------------------

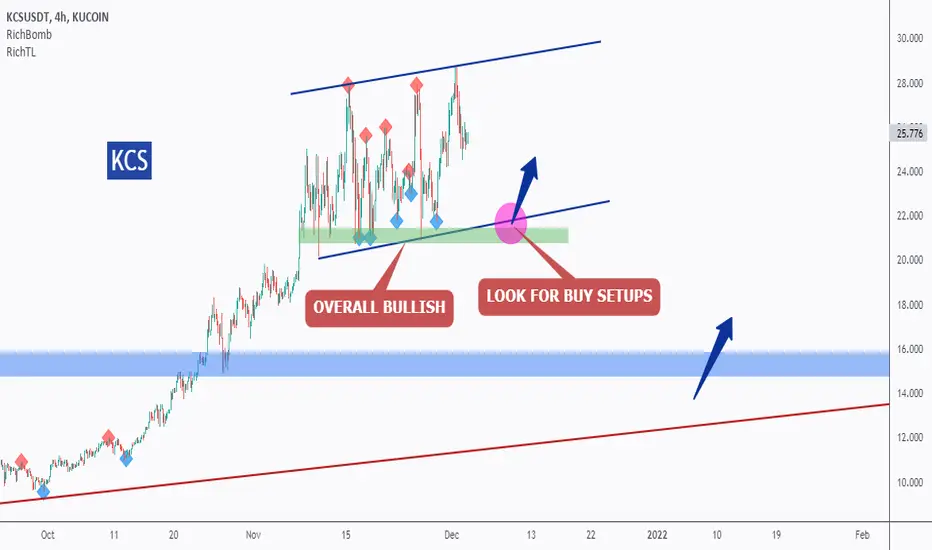
KCS - Trend-Following Setup!KCS is overall bullish trading inside the orange megaphone pattern.
Since it is sitting around the lower bound / trendline and green minor support, we will be looking for Trend-Following Buy setups.
As per my trading style, I will be looking for bullish reversal setups on lower timeframes like a double bottom, trendline break, and so on...
[bKCS would be overall bullish unless the sellers manage to break below the green zone downward, then a movement till the lower blue support would be expected where we will be looking for new buy setups to form.
Always follow your trading plan regarding entry, risk management, and trade management.
Good luck!
All Strategies Are Good; If Managed Properly!
~Rich

KCSUSDT: The Perfect Time To Buy Again | More Upside is ExpectedIn one of the scenarios published on the previous analysis on December 2, I was watching also for the price to test the low of the rectangular pattern again and as we can see it already happened.
Now we can see also an interesting fact added in our chart. On December 4, and December 6 we can see a big sell of and after that all the price decrease was recovered again.
So as we can see the price has its own comfort area located between 21 and 27.5
When the price will move above the comfort area from the technical perspective it should explode very strong to the upside.
So Let's say that if we only take into consideration to inside this area the price reaction is huge +30.95%
Targets:
27.50 if we buy lower again at 21 or +31%
32. 40 or 54.30%
35.00 or 66.60%
45.30 or 115.70%
Thank you and Good Luck!
First analysis:
Second analysis:
Third analysis:

🔥 KuCoin Token W-Shaped RecoveryKCS has seen some very strong bearish price action over the last couple of days, losing almost 40% of its value at some point.
Massive sell-offs like these do often provide interesting opportunities to "buy the dip" and ride the recovery. With the stock market and BTC seeing bullish price action today, I doubt that we're going to see another steep drop in the near future.
For KCS, the first recovery target would be the mid-line of the W, around $23.5. In case of a strong move above that area, I'm looking at the ATH value of $28.7 for a potential exit.
Happy trading!

KCS/USDTThis price is no more than a joke for the currency of the fourth largest crypto exchange in the world. In this price correction, be sure to pay attention to it.

KCS/USD - Kucoin Token holds strong despite market carnage!!!Centralized exchange tokens have held very strong despite today's market meltdown. This is clearly shown by the KCS/BTC chart, where KCS is in the green versus Bitcoin. The same applies to BNB or FTT.
This means demand for exchange tokens remains high and the bears did not manage to break their key support levels.
Despite a drop to $18 during the crash, KCS recovered entirely and is now firmly placed above the support line at $21. This is again a sign of strength!
Key Support level: $21
Key Resistance level: $34
The bears did not manage to close the price below the key support level, this is bullish and shows the bulls remain in control of KCS's price.
Technical Indicators:
Trading Volume: High volume on this drop, but KCS recovered well and FAST. This is bullish.
RSI: The RSI continues to drop on the daily timeframe. Bulls need to be careful as bears may attempt another break of this key support and it is important for KCS to not lose this level.
MACD: The 3-day MACD remains bullish, but it is fast approaching a bearish cross. Hopefully, KCS manages to consolidate at this level and not close a daily candle below the key support.
Bias:
The bias for KCS is neutral at this time. Best to be careful considering the current market conditions. The bears may attempt another break of the support level. If they are successful, KCS can quickly fall towards $15.
Short-Term Prediction for KCS Price:
Expect to see KCS price just above the $21 support level in the near term. But watch out, as this level has been under a constant attack from bears. Price has held well every time so far. If the overall market continues to drop, then the pressure will build up on bulls.
Also check my BTC idea below for a status update on the overall market.
Like and follow if you liked my idea!

kcs analysistarget and stop loss are explaned in chart / kucoin coin is good invesrmint loss ratio
so invest 5% of your wallet

KCS; sign of strengthStrong resistance at 25$ area. Can go parabolic soon. More on chart
DCA'ing some more!
KCS - Trend-Following Setup!KCS is overall bullish trading inside our blue channel so we will be looking for Trend-Following Buy setups as it approaches the lower blue trendline.
Moreover, the green area is a medium-term support area.
So the highlighted purple circle is a strong area to look for buy setups as it is the intersection of the green support and lower blue trendline.
As per my trading style:
I will be waiting for it to approach the highlighted purple circle area to look for buy setups (like a double bottom, trendline break, and so on...)
We would be overall bullish unless the sellers manage to break below the green zone downward, then a movement till the lower blue support would be expected where we will be looking for new buy setups to form.
Always follow your trading plan regarding entry, risk management, and trade management.
Good luck!
All Strategies Are Good; If Managed Properly!
~Rich
Will we see exponential growth on KCS?KCS is slowly but surely preparing for its fifth wave, which should end over the rising channel!
KCS is undoubtedly completing its growth cycle, which will be followed by a correction. This correction can range from -50% to -80% . At best, this correction will end at the bottom of the channel, at worst, below it, which could mean a longer consolidation for KCS. This would mean more time and better prices for us to buy

KCS to let some steam go?Looks to me Kucoin is forming a blowoff top showing signs of weakness with a failure to break free we could look to have a retest of strong support at $14 and bounce or consolidation and drop to the $4 zone for some ripsaw action before traveling higher

KCSUSDT: Range Trading Movements| It Will Explode Really SoonIn the 4-hour chart, the price is moving within a trading range between $21 and $26.50
The flag pattern was completed in a period of time of two weeks.
Yesterday the price exploded on the model invalidated the consolidation.
This is increasing the chances for more price increases.
From the previous analysis, we have had the chance to close twice profits from 28% to 30% and that is not all as it seems.
Despite the fact that it looks like a fake breakout as the price is already inside the pattern, I do not think this is a big issue as the volume is too high and it should move higher very soon.
Even if the price will test the low of the pattern again at $21 we should be ready to buy again and adding into the old positions or opening new once as that looks a very interesting and strong area for the BULLS (buyers).
In the daily chart , we are still bullish as the bigger picture looks really promising for more upside. This small flag was the consolidation above the broken daily structure.
On the weekly chart, the price invalidated the two-week high, reaching another all-time high of 28.75 yesterday.
Targets:
27.80 if we buy lower again at 21 or +31%
32. 40 or 53.55%
35.00 or 65.90%
45.30 or 114.60%
Thank you and Good Luck!
First and Base analysis:
Second analysis:

KCSSalaam
Good day.
Here we have a falling wedge.
It seems could be the bottom for now.
You could waiting to break to the upside and retest.
Good luck,

#Bullish on KCS because of good #RSi #MACD and FA#Bullish on KCS because of good #RSi #MACD and FA, took a small long position.
Note: This is not financial Advice just my own trading opinion and personal trade info, DYOR before investing/trading any crypto or coin, I do not take any responsibility of the loss assumed by you in any trade you took based on my analysis. Please do share your analysis as overall it helps the community and encourages participation, thanks for reading whole note, Please feel very free to type in your analysis or point, will be happy to read and reply as sharing information is sharing wealth. Good Luck!!!

KUCOIN TOKEN FORECAST
FUNDAMENTAL ANALYSIS
KCS is the token of the Crypto trading platform, KUCOIN
this platform is becoming more popular due to the simple user interface
their native token started performing well in recent time and there is every indication that it will keep the momentum going
let's just say KCS is to BNB as ETH is to BTC
with a current market cap of 2Billion and a Max supply of 117M (similar to BNB) i see no reason why KCS will not hit between 60$ to 100$ per coin in 2022
TECNICAL ANALYSIS
KCS just broke a strong resistance zone @ 27.7$
the token has been doing well so far and it looks like its going to keep going up to 50$
there is likely going to be a short term retracement to test the newly formed resistance zone at @27.7$
Pls do your own research before making any decision

KuCoin Token (KCS) technical analysisKeep an eye on KCS; price has been oscillating sideways in a channel. Now, it seems that the price is going to break the upper band on the channel. If successful, there is no resistance on its way! (be careful of price's pullback on the channel)

KCSUSDT Bullish signal on LMACD. What to watch for.$40-70 targetThe KuCoin token is forming today a very strong bullish signal on the 1D time-frame. The LMACD indicator is making a Bullish Cross. As you see on the chart, since June, every time the LMACD formed a Bullish Cross following a Bearish Cross top, the price soared by more than 50% (in particular +50%, +105% and +175% on those three times).
The dominant pattern has been a Channel Up since the May bottom and as you see, if KCSUSDT indeed rises following the LMACD Bullish Cross, it will break this Channel to the upside for the first time since the bottom. Technically, the higher Fibonacci extensions (1.5 Fib and 2.0 Fib) will start playing their part if that happens. So you may consider this potential break-out as an additional confirmation bullish signal.
It is interesting to note at this point that the U.S. Dollar Index (DXY) also offers great insight to potential rallies on KCS. On this chart the DXY is displayed by the green trend-line and as you see, since the first LMACD Bearish Cross signal in mid June, most rallies on the KuCoin Token have coincided with drops on the DXY, which is natural for assets valued in USD terms. Since November 25 the DXY has started to pull-back so that may be an extra early signal of an upcoming rally on KCS.
Personally I am not missing out on this buy opportunity and neither should you. I have the following three successive targets: $40, $50 and $70 within a two-month horizon.
--------------------------------------------------------------------------------------------------------
** Please support this idea with your likes and comments, it is the best way to keep it relevant and support me. **
--------------------------------------------------------------------------------------------------------

KCSUSDT: Brick by Brick! Time To Move UPFrom the previous analysis below we have projected the first 5 wave development motion in the KCS, with very realistic targets for the near future.
As we can see, price continues to consolidate over the broken structure and is now creating a 4-hour triangular pattern as a continuation pattern.
A price movement above the triangle would increase the chances of stronger bullish momentum.
Targets:
32. 40 or +53.55%
35.00 or +65.88%
45.30 or +114.6%
Thank you and Good Luck!
Previous Base Analysis:

KCSUSDT: An Interesting Crypto To ConsiderKey Information:
KCS is the native token of KuCoin, which was launched back in 2017 as a utility token that allows traders to share the growth benefit of the exchange.
The total supply of KCS was set at 200 million, and there is a planned buyback and burn until just 100 million KCS remain.
So Let's see the technical perspective:
Since at the beginning of this year, this KCS token rose up in price approximately from $1 up to the top at $27.8
During this month November-21, the price made a new high again.
This confirmed a new structure higher and the continuation for more upside movement.
As long as the price made a new high we can suppose that from Feb-21 up to Apr-21 the price completed wave 1 of a bigger cycle.
Actually, we should be in the 3-rd wave of a lower cycle (in red) that should complete very soon the 3-rd wave of the bigger cycle (in blue)
I am expecting the price to complete this wave in the price area between $32.40 and $35.
That movement corresponds to an increase in the price from +53.55% to ++65.88%
This is only the conservative scenario as we may have also an aggressive wave that can extend itself up to the levels of the 5-the wave (in blue)
that I'm expecting and the price can double as well.
And this can be only the beginning... [ b]
Targets:
32.40 or +53.55%
35.00 or +65.88%
Thank you and Good Luck!

[Update] KCS / UDST New ATH with fake breakout for correction ?Hey traders, KCS / USDT is in an uptrend with the check in the previous session and the test of a diagonal resistance zone in (yellow).
Big potential to breakout the resistance then the ATH to test the diagnostic resistance zone in (pink) with a return of volume on the highest and it is possible when it corrects strong to fade the bearish divergence on the RSI.
Beware of the MACD crossing, it may be a false bullish signal.
This is not an investment but a recommendation for use
Thank you for taking the time to read my analysis.
I hope you enjoyed it.
Good luck in your transactions, stay in your investor memory.
If you like my posts, mash the Like button👍
Please FOLLOW, thank you!

KCSUSDT is creating a channelKCSUSDT is creating a channel between the daily structures.
IF the price is going to have a breakout, According to Plancton's strategy (check our Academy ), we can set a nice order
–––––
Follow the Shrimp 🦐
Keep in mind.
🟣 Purple structure -> Monthly structure.
🔴 Red structure -> Weekly structure.
🔵 Blue structure -> Daily structure.
🟡 Yellow structure -> 4h structure.
⚫️ Black structure -> <4h structure.

This is where you buy KCSAbove the ML, holding tight support. Markets are trending and i don't fight sentiment.
Expecting 50ish soon on KCS.
Breaking the ML means a severe correction, not going to happen.
Not Financial Advice
