KCSUSD LongKCS consolidation support level $8.8 resistance $9.8 difference is 11%. the highest volatility is on $9.13 level...
KCSUSDT trade ideas

KCSUSDT pullback time?The price had a nice breakout from the descending channel where the market created a descending channel above the weekly support on 8.7$ area.
Now the price is testing the resistance on 9.6$ area, it's a key level
How to approach it?
The price could create a retracement until 0.5 0.618 Fibonacci level, so According to Plancton's strategy , we can set a nice order
–––––
Keep in mind.
🟣 Purple structure -> Monthly structure.
🔴 Red structure -> Weekly structure.
🔵 Blue structure -> Daily structure.
🟡 Yellow structure -> 4h structure.
⚫️ black structure -> <= 1h structure.
–––––
Follow the Shrimp 🦐

KCS - Long-Term and Short-Term Scenarios!Hello TradingView Family / Fellow Traders. This is Richard, as known as theSignalyst.
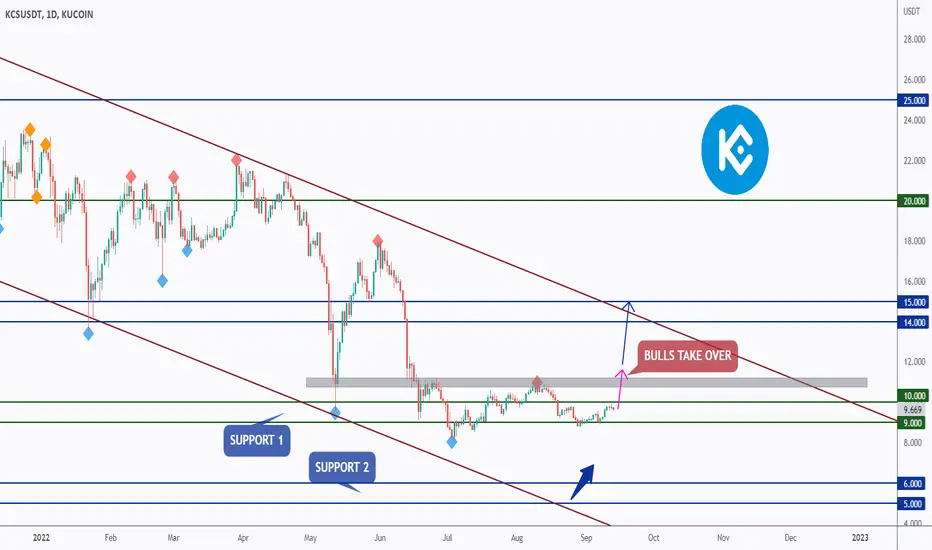
KCS is still struggling around support and round number 9.0 - 10.0 support, so we will be looking for buy setups.
From a long-term perspective: (Left Chart)
KCS is stuck inside a range. For the bulls to take over, we need a break above the gray neckline. In this case, a movement till 15.0 would be expected.
From a short-term perspective: (Right Chart)
For the bulls to take over, we need a break above the blue zone.
Meanwhile, we are bearish and if the bears manage to push below the orange zone / previous major low, then we will be expecting further movement downward.
Which scenario do you think is more probable and why?
Always follow your trading plan regarding entry, risk management, and trade management.
Good luck!
All Strategies Are Good; If Managed Properly!
~Rich

KCSUSDT wants the breakout!The price is testing the descending channel as resistance on the daily timeframe.
The price got the liquidity from the weekly support as I told you in my previous analysis
How to approach it?
IF the price is going to have a breakout and retest it as new support, According to Plancton's strategy , we can set a nice order
–––––
Keep in mind.
🟣 Purple structure -> Monthly structure.
🔴 Red structure -> Weekly structure.
🔵 Blue structure -> Daily structure.
🟡 Yellow structure -> 4h structure.
⚫️ black structure -> <= 1h structure.
–––––
Follow the Shrimp 🦐

KCS which way !Hello everyone, HADI IS HERE
if you like the idea, do not forget to support with a like and follow.
KCS AS we can see price is around a massive support, where we will be searching for buy setups
price stuck inside this range recently, however price broke above this minor swing high
so now what ?
for a medium term perspective price need a momentum candle close above this major swing high to confirm that the bulls took the control
until that happens price can still dive more before going up
and as usual follow your trading plan and manage your risk.
Be patient and good luck!

KCSUSDT needs to hold the Support!The price is testing the weekly support at 8.7$ area where the market created the double bottom
How to approach it?
IF the price is going to create a new breakout, we could see a new lower low, so According to Plancton's strategy , we can set a nice order
–––––
Keep in mind.
🟣 Purple structure -> Monthly structure.
🔴 Red structure -> Weekly structure.
🔵 Blue structure -> Daily structure.
🟡 Yellow structure -> 4h structure.
⚫️ black structure -> <= 1h structure.
–––––
Follow the Shrimp 🦐

Kucoin KCSLiterally trading right at resistance while our exponential trend line is getting steeper right now! A break does not look right to fit this scenario which is why we should see serious upside right now.

KCS had a nice price increase during the last week!KCS had a nice price increase during the last week. After the price hit the support range of $8.85 to $8.65 and saw a positive reaction, we saw the price increase again. The resistance range of $9-$9.10 has again become support. Last week's candle of this currency is a Doji candle with a very small body, which is a good sign of the support range. This week, the new candle is above the previous candle's range, which can again be a good sign for possible price growth.
The currency trend is bullish in the 4-hour time frame, and there is potential for further price growth to the resistance of the $10 range. Also, if there is no drop in the market for the current week, its price growth can continue up to the resistance range of $10.6 to $11.20. But if the downward trend in the whole market resumes, by breaking the support of $8, the price decrease can continue to $7.6-$7. If we break the support of the rising trend line on the RSI, we can expect the trend to reverse.

KCS/USDTKCS/USDT
The price has fallen enough and has reached the support of the bottom of its descending channel.
I think the price may drop a bit and then continue to grow.
#KCS #KCSUSDT #BTC #BTCUSD #LUNA #LUNC #UST

WHAT WE ARE WAITING FOR KCS Hello everyone, HADI IS HERE
if you like the idea, do not forget to support with a like and follow.
KCSUSDT, as we can see price is diving more and more inside the support zone
so what we are waiting for ?!
price is forming a trendline waiting for the third swing high to form, then a break above the box marked in the picture
or- price can still break above this major high before forming the new swing for the bulls to prove control right !
until that price can still make new lower lows and lower highs before going up
and as usual follow your trading plan and manage your risk.
Be patient and good luck!

KCS - Strong Support!Hello TradingView Family / Fellow Traders. This is Richard, as known as theSignalyst.
KCS is sitting around a strong support zone (9.0 - 10.0), so we will be looking for buy setups on lower timeframes.
As per my trading style:
Since KCS is sitting around a support zone , I will be looking for bullish reversal setups (like a double bottom pattern, trendline break , and so on...)
Of course, unless the support is broken downward, in this case it would become resistance and further bearish movement would be expected.
Which scenario do you think is more probable and why?
Always follow your trading plan regarding entry, risk management, and trade management.
Good luck!
All Strategies Are Good; If Managed Properly!
~Rich

KCSUSDT is testing the supportThe price is testing the daily support on 9$ area where the price had a previous breakout and retest.
The market got a clear rejection from the 10$ area where we can find dynamic and static resistance.
How to approach it?
IF the price is going to have a breakout from the daily support and retest as new resistance, According to Plancton's strategy , we can set a nice order
–––––
Keep in mind.
🟣 Purple structure -> Monthly structure.
🔴 Red structure -> Weekly structure.
🔵 Blue structure -> Daily structure.
🟡 Yellow structure -> 4h structure.
–––––
Follow the Shrimp 🦐

KCS/USD - Downtrend Continues. Critical Support at $8.8 😲KuCoin Token lost the bullish momentum in mid-August and since then it's been a non-stop downtrend for its price.
After being rejected at $11, KCS crashed to the key support at $9.3. Later, it failed to recover and fell back lower to $8.8 which is our current support.
If buyers can't stop the downtrend here, then the next key support is at $8.3.
The current resistance is found at $9.4 and it is unlikely it will be tested any time soon.
The indicators remain bearish, but sellers seem to have lost some interest in pushing KCS lower at this time. This gives some relief to bulls which could defend the key support at $8.8 and stop the downtrend.
Looking ahead, KCS will likely follow the overall market which continues to be bearish, particularly because both BTC and ETH have made lower lows.
KCS is no different and the drop this Monday made a low not seen since July. Hence, my bias is somewhat bearish on this price action.
Keep a close eye on the key support and be patient before taking a position, the market is very fragile right now.
Like and follow if you liked this idea!

KCSUSDT At the bottom of the 2.5 month Channel UpThe KuCoin token (KCSUSDT) has been trading within a Channel Up since the July 03 low. At the moment, following the September 12 rejection on the 1D MA50 (blue trend-line), the price is at the very bottom zone (Higher Lows) of the Channel Up, a level where it last rebounded on August 29. The current Resistance levels on the short-term are the 1D MA50, the 1D MA100 (green trend-line) and the 0.618 Fibonacci retracement level from the dominant long-term Channel Down that started after the December 01 2021 market Top.
Technically a break below the the bottom of the Channel, targets first the July 03 Low and if we close below it too, then the 0.5 Fib near $7.000. With the 1D MA50 potentially about to cross above the 1D MA100 to form a Bullish Cross, and more importantly the MACD on the 1W time-frame above to form the first Bullish Cross since October 21 2021, the KuCoin token may very well reverse aggressively, even on the medium-term and after breaking the 1D MA100, target the 0.786 Fibonacci level.
Overall KCSUSDT remains one of the best long-term investments in the market not just for technical but also for fundamental reasons I have previously explained.
--------------------------------------------------------------------------------------------------------
** Please support this idea with your likes and comments, it is the best way to keep it relevant and support me. **
--------------------------------------------------------------------------------------------------------

KCSUSDT Rising Wedge still holding. How to trade the break-outs.This is an analysis on the KuCoin Token (KCSUSDT), the native token of the KuCoin cryptocurrency exchange, which enables a profit-sharing model between the platform and its users. Today's analysis is on the 4H time-frame, where we'll be presenting the medium-term trend and the trading opportunities on certain levels.
** Technical Analysis **
The primary pattern we see is a Rising Wedge since the August 29 Low. The structured pattern of Higher Lows and Higher Highs (so far two of each) offers low risk sideways opportunities by buying at the bottom (where the price is at now) and selling at the top. Notice how all key MA periods, 1D MA50 (red trend-line), 4H MA200 (orange trend-line), 4H MA100 (green trend-line) and 4H MA50 (blue trend-line), trade within the Rising Wedge. Also its range is now firmly within the 0.382 and 0.618 Fibonacci retracement levels.
A break above the top of the Rising Wedge, if it comes with a candle close above the 1D MA50, can be taken as a buy break-out signal, targeting the 11.000 August 10 High. Similarly, a break below the Wedge, can be best taken as a sell break-out signal if the lower Support (of the September 07 Low) breaks, in which case we can target the lower Fib levels.
Keep in mind however that we are already past a 4H MA50/100 Bullish Cross, which last time it happened (July 15), KCS was still at the start of a 1.5 month rally. Also notice the 4H RSI Support Zone that is holding since June 18. It can offer a solid buy entry for quick short-term profits.
** Fundamental Analysis **
Overall, with a market cap of roughly $900 million, the KCS token is an innovative way for KuCoin to share 50% of the platform’s trading revenue with holders of the token on the exchange. In addition to receiving rewards in revenue sharing, KCS holders also enjoy fee discounts and the opportunity to participate in initial token offerings and other unique services offered by KuCoin.
Those are just a few reasons that make us consider the KuCoin token as one of the best long-term investments in the crypto market. KuCoin is one of the largest cryptocurrency exchanges in the world, with a user base that runs into tens of millions. An uptick in new market investors can increase the platform’s user base, increasing its revenues and the KuCoin Token price. The KCS token can also gain higher value in the future as the KCC ecosystem evolves and adds more decentralized applications. As KuCoin’s operations scale and evolve further, KCS could become even more lucrative as a digital asset to trade and HODL.
If you are a long-term investor, it would be in your best interest to buy now that the price is at a great discount, more than -70% from its All Time High.
--------------------------------------------------------------------------------------------------------
** Please support this idea with your likes and comments, it is the best way to keep it relevant and support me. **
--------------------------------------------------------------------------------------------------------

Kucoin Down Down Down Broadening formationTwo strange items of analysis...
First a Broadening formation (Triangle shaded area) has formed over the last few weeks.
Technically, it is likely to break below the support, as the previous trend was down.
Target 1 will be around $8.00...
On the peripheral side. The RSI is making higher lows, which is showing bullish momentum.
It looks like Alt Coins are waiting for some catalyst to decide where the next direction is... With the Ethereum merge going from PoW to PoS, it seems like this is like moving from the Barter system to the Financial banking system.
One big problem for this - Centralisation for the coin!
This is not a bullish signal to buy any crypto and sets a precedent for danger ahead.
Hence I'm going short...

KCSUSDT close to testing the 5-month Resistance.The KuCoin Token (KCSUSDT) has been trading on its 1D MA50 (blue trend-line) for the past three days. This consolidation is taking place as the 1D MA100 (green trend-line) is descending to a point that is the closest it has been since the June 01 rejection. Basically, KCS has been trading below the 1D MA100 since April 29 and naturally it is the most important Resistance on the medium-term.
As this 1D chart shows, the token has been trading within a long-term Channel Down pattern since the December 01 2021 market High. There is reason to believe that this long-term bearish trend is coming to an end as it is the first time during this period that the MACD indicator is about to form a Bullish Cross on the 1W time-frame. In fact if formed, it will be the first time since October 22 2021. Keep an eye also on the 1D RSI, which is closing in on its Symmetrical Resistance Zone. A break above it can be an early indication of a long-term trend shift to bullish.
As a result, a 1D candle close above the 1D MA100 should be taken as a bullish signal, targeting the 1D MA200 (orange trend-line), which has been trading on the Channel's top since June 01. That is the final Resistance before a long-term Bull rally on the KCSUSDT. If you are a long-term investor, it is important to buy as early as possible on levels of course that you feel comfortable with. Overall Tradingshot considers this an excellent long-term investment.
--------------------------------------------------------------------------------------------------------
** Please support this idea with your likes and comments, it is the best way to keep it relevant and support me. **
--------------------------------------------------------------------------------------------------------

KCS - Potential Bullish Reversal!Hello TradingView Family / Fellow Traders. This is Richard, as known as theSignalyst.
KCS is still struggling around support and round number 10.0 and since the price is above it, we will be looking for buy setups.
For the bulls to take over, we need a break above the gray neckline. In this case, a movement till 15.0 would be expected.
Meanwhile, if the bears manage to push below 9.0, then we will be expecting further movement downward.
Which scenario do you think is more probable and why?
Always follow your trading plan regarding entry, risk management, and trade management.
Good luck!
All Strategies Are Good; If Managed Properly!
~Rich
KCS| KuCoin | The Bulls Have The Price Under ControlKCS| KuCoin | The Bulls Have The Price Under Control
During the previous analysis, the price broke out from the
wedge pattern and it didn't invalidate it.
That was a strong signal that the price would have increased more during the coming days and
as we can see from the previous analysis the first target was reached.
Now I am expecting any price correction between 9.5-9.9 before
the price move up again.
Targets on the chart!
Thank you and Good Luck!
Previous Analysis!

KCSUSDT: Long Signal Explained
KCSUSDT
- Classic bullish setup
- Our team expects growth
SUGGESTED TRADE:
Swing Trade
Long KCSUSDT
Entry - 9.713
Stop Loss - 9.031
Take Profit - 10.735
Our Risk - 1%
Start protection of your profits from lower levels.
❤️ Please, support our work with like & comment! ❤️

KCSUSDt is testing the daily resitanceThe price created a double bottom on the daily support at 9$ area where the market created a local demand zone,.
The price had a nice breakout from the 4h resistance on 9.6$ and now the price is testing another key level on 9.8$
How to approach it?
IF the price is going to have a breakout from the daily and retest as new support, According to Plancton's strategy , we can set a nice order
–––––
Keep in mind.
🟣 Purple structure -> Monthly structure.
🔴 Red structure -> Weekly structure.
🔵 Blue structure -> Daily structure.
🟡 Yellow structure -> 4h structure.
–––––
Follow the Shrimp 🦐

Bullish Head and Shoulders on KuCoin Shares TokenWe have a Bullish Harmonic Head and Shoulders Visible on the Daily in KuCoin Shares and i will be looking for a move upo to the 200 Day Moving Average

KCSUSDT Consolidating for now. Opportunities trading break-outsThe KuCoin token (KCSUSDT) has been consolidating around both the 4H MA50 (blue trend-line) and the 4H MA100 (green trend-line) for the past week while being on Higher Highs and Higher Lows since the August 29 Low. We view this as a consolidation phase for the next big move not necessarily an emerging bullish set-up as the trend has been bearish medium-term since the August 10 High. It is however the first time since that top, that the short-term price action looks more promising.
Regardless of that, there is a Lower Highs trend-line to respect and until the previous Lower High (9.820) breaks, we should expect further downside it the current Support (8.900) breaks. In that case, wait for the price to enter the bottom of the RSI Support Zone, before buying again. As you see this Zone has been extremely consistent at identifying buy entries since June 18.
On the other hand, the buy break-out signal will be when the price breaks above the 4H MA200 - 1D MA50 Resistance cluster (orange and red trend-lines) respectively, which is currently exactly where the previous Lower High of August 25 is (8.900). In that case, the medium-term trend should switch back to bullish and we can target first 10.500 and then the 11.000 High.
--------------------------------------------------------------------------------------------------------
** Please support this idea with your likes and comments, it is the best way to keep it relevant and support me. **
--------------------------------------------------------------------------------------------------------
