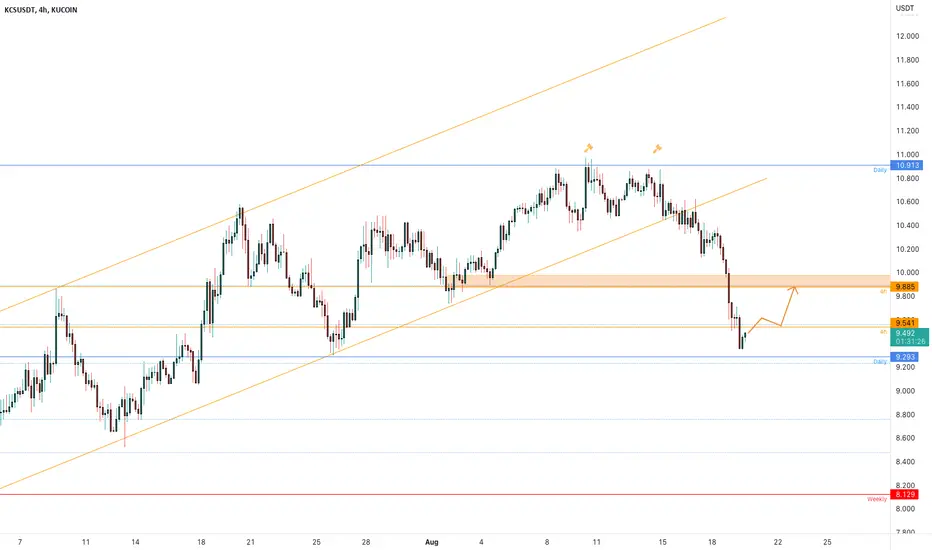
KCSUSDT is testing the key levelsThe price tested the 0.786 Fibonacci level on the daily timeframe inside a descending channel on the 4h timeframe.
How to approach it?
IF the price is going to create a clear breakout from the channel and retest the daily resistance as new support, According to Plancton's strategy, we can set a nice order
–––––
Keep in mind.
🟣 Purple structure -> Monthly structure.
🔴 Red structure -> Weekly structure.
🔵 Blue structure -> Daily structure.
🟡 Yellow structure -> 4h structure.
–––––
Follow the Shrimp 🦐
KCSUSDT trade ideas

KCS - Long-Term and Short-Term Scenarios!Hello TradingView Family / Fellow Traders. This is Richard, as known as theSignalyst.
KCS is still struggling around support and round number 9.0 - 10.0 support, so we will be looking for buy setups.
From a long-term perspective: (Left Chart)
KCS formed a valid inverse head and shoulders pattern, but it is still not ready to go yet.
For the bulls to take over, we need a break above the gray neckline. In this case, a movement till 15.0 would be expected.
From a short-term perspective: (Right Chart)
For the bulls to take over, we need a break above the blue zone.
Meanwhile, we are bearish and if the bears manage to push below 9.0 and previous low, then we will be expecting further movement downward.
Which scenario do you think is more probable and why?
Always follow your trading plan regarding entry, risk management, and trade management.
Good luck!
All Strategies Are Good; If Managed Properly!
~Rich

KCSUSDT Moment of truth for the KuCoin Token.The KuCoin Token (KCSUSDT) just made a Bearish Cross with the MA50 (blue trend-line) crossing below the MA100 (green trend-line) on the 12H time-frame). This is coming less than a month after the opposite pattern, the Bullish Cross on August 05.
The last time we saw this exact sequence of technical events was between April 05 and May 03. As you see, even the LMACD sequences are similar. After the price failed to break the MA100 it fell to the final consolidation belt where the Bearish Cross was formed and that initiated a massive sell-off. So far this is exactly what has been happening, with KCS being rejected on the MA100 and now consolidating as the Bearish Cross was formed.
Technically a break below this week's low can trigger another sell-off. On the other hand, a break above the MA100, invalidates the bearish bias of that past fractal. Indeed a moment of truth for the KuCoin token, a project that we believe a lot and stand behind it as a solid long-term investment.
--------------------------------------------------------------------------------------------------------
** Please support this idea with your likes and comments, it is the best way to keep it relevant and support me. **
--------------------------------------------------------------------------------------------------------

KCS| KuCoin Token Falling Wedge Pattern | Wait For BreakOutKCS| KuCoin Token Falling Wedge Pattern | Wait For BreakOut
At the mid of August KCS token tested a very strong resistance zone near $11
After that price completed a "Rising Wedge" pattern that pushed the price lower again.
Actually, The price is create the opposite scenario to increase the price again.
This time we can see a very nice "Falling Wedge" pattern or a bullish pattern.
When the price will bounce above the pattern will increase the chances
for the next bullish movement.
Thank you and Good Luck!

KCSUSDT 1d - our target $14Kucoin token has reached the important mark of $9 . In our previous forecast, the price of KCS was at a critical point, from which there was a high probability of a reversal and the formation of a new falling wave:
As we can see from the previous forecast, the previous red scenario worked and now is the time to buy KCS.
However, looking at the prospect of bitcoin continuing its wave of decline, we recommend dividing the amount of investment in the kucoin token into 2 parts: in the range of $9 and in the range of $7.5. In the case of the formation of the last wave of decline in the cryptocurrency market, you will get a good average price of $8.25.
KCSUSDT's first growth target remains near $14
_________________________________
Since 2016, we have been analyzing and trading the cryptocurrency market.
We transform our knowledge, trading moods and experience into ideas. Each "like under the idea" boosts the level of our happiness by 0.05%. If we help you to be calmer and richer — help us to be happier :)

KCSUSDT Important Lower Highs trend-line for the short-term.The KuCoin token (KCSUSDT) got rejected heavily on Friday as it failed to break above the 1D MA50 (red trend-line). As a result it failed to sustainably recover the 4H MA50 (blue trend-line) and dropped to a new Lower Highs trend-line.
That live has provided the previous (short-term) rebound on August 19. The common characteristic is that when the price rebounded on the trend-line, the 4H RSI bounced also on its Support Zone that goes back to June 19. As you see, whether KCS has been on an uptrend (Higher Lows) or (now) a downtrend (Lower Highs), it was provided always a price jump.
When it was on an uptrend, the price always hit the 4H MA100 (green trend-line) as part of a Support Zone, so we expect that it will do the same, this time as part of a broader Resistance Zone. As a result, if the price rebounds, we will be targeting the 4H MA100 on the short-term.
A break above the 4H MA200 (orange trend-line) should be enough to restore the medium-term bullish trend. A closing below the Lower Highs trend-line, should start a quick drop back to the 8.040 Support.
--------------------------------------------------------------------------------------------------------
** Please support this idea with your likes and comments, it is the best way to keep it relevant and support me. **
--------------------------------------------------------------------------------------------------------

KCS - Two Possible Scenarios!Hello TradingView Family / Fellow Traders. This is Richard, as known as theSignalyst.
KCS is still struggling around support and round number 10.0 and since the price is above it, we will be looking for buy setups.
KCS is formed a valid inverse head and shoulders pattern, but it is still not ready to go yet.
For the bulls to take over, we need a break above the gray neckline. In this case, a movement till 15.0 would be expected.
Meanwhile, we are bearish and if the bears manage to push below 9.0, then we will be expecting further movement downward.
Which scenario do you think is more probable and why?
Always follow your trading plan regarding entry, risk management, and trade management.
Good luck!
All Strategies Are Good; If Managed Properly!
~Rich

KuCoin. Keep bigger bearish picture in mindKuCoin stays bearish, based on daily and 4h structures. Send your questions below, I'll be glad to talk. Please support my work with boost and comments. Thank you for your time!

KuCoin | A Short Term Trading PerspectiveKuCoin | A Short Term Trading Perspective
Price is developing higher highs and higher lows as we can see from the chart.
On the other hand, considering also that BTC is accumulating bullish volume
we can take that as reverence combined with the out bullish pattern.
Price is getting ready to move above 9.75
Once the price will be above that zone it should increase more up to the other
short term targets.
Thank you and Good Luck!

KCSUSDT: Long Trade Explained
KCSUSDT
- Classic bullish pattern
- Our team expects growth
SUGGESTED TRADE:
Swing Trade
Long KCSUSDT
Entry Level - 9.688
Stop Loss - 9.477
Take Profit - 10.005
Our Risk - 1%
Start protection of your profits from lower levels.
Please, support our analysis with like and comment!
❤️ Please, support our work with like & comment! ❤️

KCSUSDT is testing the 4h resistancethe price bounced exactly on the 9.30$ where the market has daily support and now the price is creating an ascending channel above it.
How to approach it?
IF the price is going to flip the current 4h resistance into new support, According to Plancton's strategy , we can set a nice order
–––––
Keep in mind.
🟣 Purple structure -> Monthly structure.
🔴 Red structure -> Weekly structure.
🔵 Blue structure -> Daily structure.
🟡 Yellow structure -> 4h structure.
–––––
Follow the Shrimp 🦐

KCSUSDT wants the pullback?The price had a breakout from the ascending channel after the market got the rejection from 11$ area. In my previous idea we were waiting for a clear breakout before looking for a new long position.
Now the price is testing the daily support at 9.2$ area on the 0.618 Fibonacci level
How to approach it?
IF the price is going to have a breakout from the 4h resistance at 9.5$ are and retest is it as new support, we could see a pullback until the previous 4h support now new resistance, so According to Plancton's strategy , we can set a nice order
–––––
Keep in mind.
🟣 Purple structure -> Monthly structure.
🔴 Red structure -> Weekly structure.
🔵 Blue structure -> Daily structure.
🟡 Yellow structure -> 4h structure.
–––––
Follow the Shrimp 🦐
KuCoin | Bullish AB=CD Pattern | Still ValidKuCoin | Bullish AB=CD Pattern
During this period of time, we are looking at the market to increase the bullish volume
and to increase where it was on April 22.
However, we must be patient and realize that a strong bearish wave will not change the direction of prices so easily.
The price needs to spend some time in correction before the market crowd realizes it
that the old trend was near its end.
The correction that is happening now is all in line with the bigger picture despite the fact if
we like it or not.
On the other hand, we can see that the price is close to the completion of a bullish
harmonic pattern.
This combination can increase the chances that we can see the token increase in value very soon.
The fear and panic in the market are creating this release of liquidity.
Once it will be more stable the price will begin to increase again.
We need to look at any price reaction and after that, we can buy.
Thank you and Good Luck!
Previous Analysis:

KCSUSDT 1D Global view of possible KCS priceThe cryptocurrency market is currently at a crossroads.
Many players expect a sharp collapse, or even an update of the June 2022 lows
We are more cautious in such critical predictions
In our opinion, an increase in the KCSUSDT price to $11.24 in the near future is more than real.
And then a critical moment will come.
+ The blue scenario could trigger a super accelerated growth to $16.40
+ The red scenario will lead the KCS price to correction at near $9 with possible further growth to $14
_______________________________
Since 2016 , we have been analyzing and trading the cryptocurrency market.
We transform our knowledge, trading moods and experience into ideas. Each "like under the idea" boosts the level of our happiness by 0.05%. If we help you to be calmer and richer — help us to be happier :)

KCSUSDT is testing the resistanceThe price is creating an ascending channel on the daily timeframe after the price bounced on the weekly structure on 8.1$ area.
The price needs to create a new breakout from the 11$ area with volume and momentum and retest it as new support
How to approach?
IF the price is going to have a breakout, According to Plancton's strategy , we can set a nice order
–––––
Keep in mind.
🟣 Purple structure -> Monthly structure.
🔴 Red structure -> Weekly structure.
🔵 Blue structure -> Daily structure.
🟡 Yellow structure -> 4h structure.
–––––
Follow the Shrimp 🦐

KCS/USD - Uptrend Lost. Support at $10 and $9. 😲As expected KuCoin Token has lost the uptrend after some clear bearish signals earlier this week. See below the past idea.
Now the price is expected to test the support at $10. If that can't hold sellers, then the next key level is at $9.3. The resistance remains at $11.
The daily indicators are quickly turning bearish and MACD is about to do a bearish cross at this rate. The RSI remains above 50 points for now, but OBV is falling below the key moving averages which is another bearish signal.
It's unlikely the market will bounce here and a more substantial correction could develop after the rally in July/Aug.
Best to hold some cash for some juicy discounts later on on KCS.
Like and follow if you liked this idea.

KCSUDT going for the 1D MA100 test, 1st time since April!The KuCoin token (KCSUSDT) continues to trade within a very steady Channel Up pattern since the July 03 low, having turned the 1D MA50 (blue trend-line) into a Support for the past 13 days. This is the longest since the end of the Bull Cycle in 2021.
The next Resistance is the 1D MA100 (green trend-line), which could make contact with the price just above the 0.618 Fibonacci retracement level of the long-term Bearish Channel that KCSUSDT has been trading in since the December 01 2021 All Time High (ATH). The 1D MA100 has been unbroken since April 29 and as you see on the chart, it has had 4 clear rejections within 2022 already. As a result a closing above it will be a major bullish continuation signal, targeting the 1D MA200 (orange trend-line).
This is quite likely to happen on the long-term, considering that the MACD on the 1W time-frame is about to make a Bullish Cross for the first time since October 22 2021. On the short-term however the 1D RSI has been rejected inside an 8 month symmetrical Resistance Zone so it is more likely to see a test of the 1D MA50 as a Support, before the 1D MA100 breaks.
--------------------------------------------------------------------------------------------------------
Please like, subscribe and share your ideas and charts with the community!
--------------------------------------------------------------------------------------------------------

KCS | KuCoin | Price Is Accumulating Bullish VolumeKCS | KuCoin | Price Is Accumulating Bullish Volume
Since when we saw Bitcoin recover and the market to gets stable
KuCoin is showing to perform better as well.
The market is already calmed down after LUNA and Celsius collapse
and the trading volume in the market is getting more stable and it is growing.
On KuCoin we can see three consecutive bullish accumulation patterns.
Those are a clear sign that the traders are growing in number and the next
the bullish movement will come soon.
Thank you and Good Luck!

KCS - Wait For The Trigger!Hello TradingView Family / Fellow Traders. This is Richard, as known as theSignalyst.
on Weekly: Left Chart
KCS is still struggling around support and round number 10.0 and since the price is above it, we will be looking for buy setups.
on Daily: Right Chart
KCS is formed a valid inverse head and shoulders pattern, but it is still not ready to go yet.
For the bulls to take over, we need a break above the gray neckline. In this case, a movement till 15.0 would be expected.
Meanwhile, the bears can still kick in and push KCS lower below 10.0
Which scenario do you think is more probable and why?
Always follow your trading plan regarding entry, risk management, and trade management.
Good luck!
All Strategies Are Good; If Managed Properly!
~Rich

KCS/USD - At Critical Support, Can it HOLD?! 😲KuCoin Token attempted to move above $11, but failed to break this level.
For this reason, the uptrend appears in danger now which has lasted since July.
If buyers don't step up soon, then the price could fall to the key support at $9. The momentum is also fading as shown by the indicators.
MACD + RSI is showing a bearish divergence. Volume is not great, but maybe Monday will bring some buyers.
I suggest caution and this is not the place to take a position rather, let the market decide for you and then RE-act.
Bias is neutral, but a breakdown would turn it bearish in the short term at least.
Like and follow if you liked this idea.

KCS/USDTKCS/USDT
All altcoins reach their 100-day moving average and stabilize even above that.
Total 2 index has reached moving 100.
Do you think KCS will hit $17???
#KCS #KCSUSDT #BTC #BTCUSD #LUNA #LUNC #UST

KCSUSDT 12h Short-term long trade with tasty P/L ratioSince the publication of the idea of KCSUSDT last week, the KCS price has fallen a little short of its target.
However, we see an accumulation of forces above the $10.4 level for possible continuation of growth.
And taking into account the fact that we are also waiting for a price increase in the BTCUSDT pair
You can try a short-term long trade under the following conditions:
Entrance $10.56
Stop $10.294 (-2.5%)
Take profit $11.90 (+12.7%)
P/L ratio 5/1
_______________________________
Since 2016 , we have been analyzing and trading the cryptocurrency market.
We transform our knowledge, trading moods and experience into ideas. Each "like under the idea" boosts the level of our happiness by 0.05%. If we help you to be calmer and richer — help us to be happier :)

KCS |KuCoin | Price Broke Out Of a Key Resistance ZoneKCS |KuCoin | Price Broke Out Of a Key Resistance Zone
During the previous analysis, the price was completed on two consecutive
bullish wedge patterns.
In the first analysis, the price reached the first target only and after a good bullish accumulation,
it reached the target again on the second pattern.
So we had two consecutive bullish movements.
In the actual situation, the price is above the structure and this is showing for a very nice
bullish accumulation.
The price should rise again and may hit targets very quickly.
Thank you and Good Luck!
First Analysis:
Second Analysis:
