If you bought Kadena last cycle...you have to be DCA'ing in this zone, to give yourself a chance to exit with some gains in the upcoming pump.
Related pairs

KDA/USDT – Major Reversal Brewing from Multi-Year Demand Zone?🔍 Technical Breakdown – Weekly Timeframe
Kadena (KDA) is currently trading at a make-or-break level after months of persistent downtrend. The price is revisiting a historical multi-year demand zone between $0.31 - $0.45, an area that previously acted as a launchpad for major rallies.
This range ha


#KDA/USDT UPDATE .#KDA
The price is moving within a descending channel on the 1-hour frame, adhering well to it, and is on its way to breaking it strongly upwards and retesting it.
We have a bounce from the lower boundary of the descending channel. This support is at 0.3665.
We have a downtrend on the RSI indicator

#KDA/USDT#KDA
The price is moving within a descending channel on the 1-hour frame, adhering well to it, and is heading for a strong breakout and retest.
We are seeing a rebound from the lower boundary of the descending channel, which is support at 3370.
We have a downtrend on the RSI indicator that is abo

KDAUSDT 1W Analysis KDA ~ 1W Analysis
#KDA This is the lowest support for now. Buy if you still have confidence in this coin with a short term target of at least 15%+ from this support.

#KDA/USDT#KDA
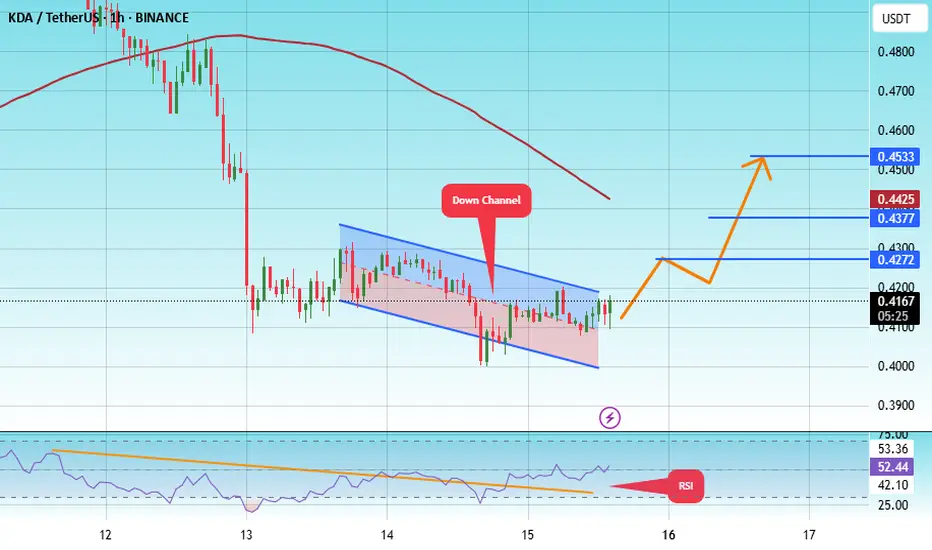
The price is moving within a descending channel on the 1-hour frame, adhering well to it, and is heading toward a strong breakout and retest.
We are experiencing a rebound from the lower boundary of the descending channel. This support is at 0.4043.
We are experiencing a downtrend on the RSI
#KDA/USDT#KDA
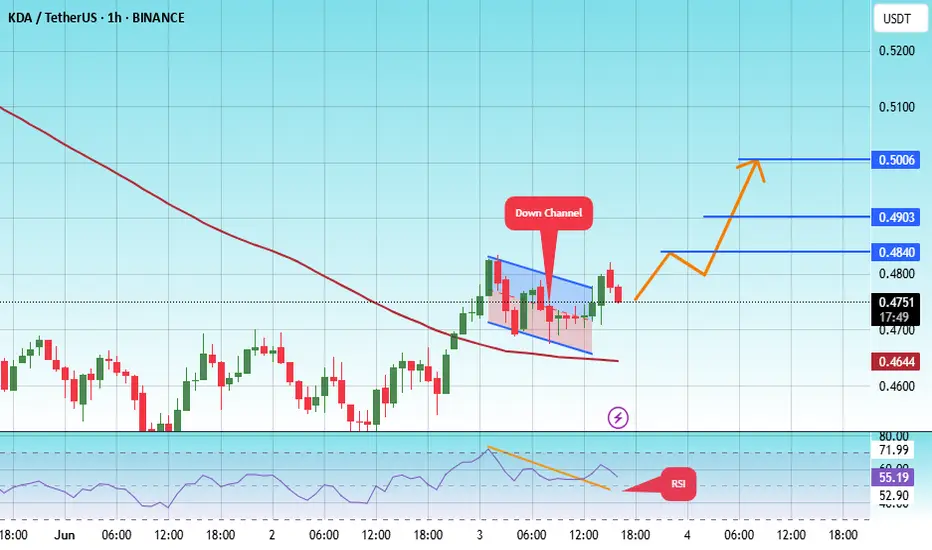
The price is moving within a descending channel on the 1-hour frame, adhering well to it, and is heading toward a strong breakout and retest.
We are experiencing a rebound from the lower boundary of the descending channel. This support is at 0.4770.
We have a downtrend on the RSI indicator th
#KDA/USDT#KDA
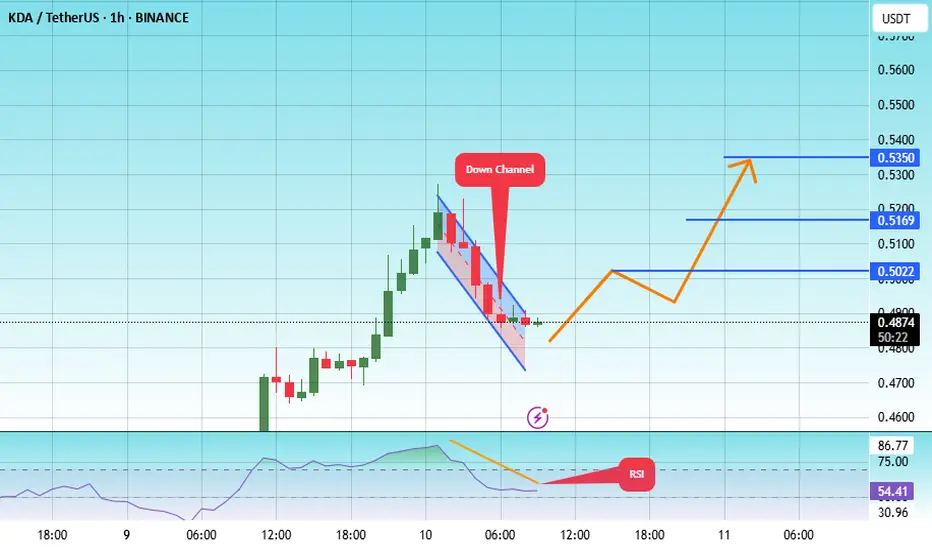
The price is moving within a descending channel on the 1-hour frame, adhering well to it, and is heading for a strong breakout and retest.
We are seeing a rebound from the lower boundary of the descending channel, which is support at 0.5780.
We have a downtrend on the RSI indicator that is ab

#KDA/USDT#KDA
The price is moving within a descending channel on the 1-hour frame, adhering well to it, and is heading for a strong breakout and retest.
We are experiencing a rebound from the lower boundary of the descending channel. This support is at 0.4670.
We are experiencing a downtrend on the RSI ind
See all ideas
Summarizing what the indicators are suggesting.
Oscillators
Neutral
SellBuy
Strong sellStrong buy
Strong sellSellNeutralBuyStrong buy
Oscillators
Neutral
SellBuy
Strong sellStrong buy
Strong sellSellNeutralBuyStrong buy
Summary
Neutral
SellBuy
Strong sellStrong buy
Strong sellSellNeutralBuyStrong buy
Summary
Neutral
SellBuy
Strong sellStrong buy
Strong sellSellNeutralBuyStrong buy
Summary
Neutral
SellBuy
Strong sellStrong buy
Strong sellSellNeutralBuyStrong buy
Moving Averages
Neutral
SellBuy
Strong sellStrong buy
Strong sellSellNeutralBuyStrong buy
Moving Averages
Neutral
SellBuy
Strong sellStrong buy
Strong sellSellNeutralBuyStrong buy
Displays a symbol's price movements over previous years to identify recurring trends.
Curated watchlists where KDAUSDT is featured.

Smart contracts: Make the smart decision
36 No. of Symbols
See all sparks
Frequently Asked Questions
The current price of KDAUSDT SPOT (KDA) is 0.4077 USDT — it has fallen −0.59% in the past 24 hours. Try placing this info into the context by checking out what coins are also gaining and losing at the moment and seeing KDA price chart.
KDAUSDT SPOT price has risen by 0.60% over the last week, its month performance shows a −20.75% decrease, and as for the last year, KDAUSDT SPOT has decreased by −19.55%. See more dynamics on KDA price chart.
Keep track of coins' changes with our Crypto Coins Heatmap.
Keep track of coins' changes with our Crypto Coins Heatmap.
KDAUSDT SPOT (KDA) reached its highest price on Aug 8, 2022 — it amounted to 2.4472 USDT. Find more insights on the KDA price chart.
See the list of crypto gainers and choose what best fits your strategy.
See the list of crypto gainers and choose what best fits your strategy.
KDAUSDT SPOT (KDA) reached the lowest price of 0.3209 USDT on Apr 7, 2025. View more KDAUSDT SPOT dynamics on the price chart.
See the list of crypto losers to find unexpected opportunities.
See the list of crypto losers to find unexpected opportunities.
The safest choice when buying KDA is to go to a well-known crypto exchange. Some of the popular names are Binance, Coinbase, Kraken. But you'll have to find a reliable broker and create an account first. You can trade KDA right from TradingView charts — just choose a broker and connect to your account.
Crypto markets are famous for their volatility, so one should study all the available stats before adding crypto assets to their portfolio. Very often it's technical analysis that comes in handy. We prepared technical ratings for KDAUSDT SPOT (KDA): today its technical analysis shows the buy signal, and according to the 1 week rating KDA shows the sell signal. And you'd better dig deeper and study 1 month rating too — it's sell. Find inspiration in KDAUSDT SPOT trading ideas and keep track of what's moving crypto markets with our crypto news feed.
KDAUSDT SPOT (KDA) is just as reliable as any other crypto asset — this corner of the world market is highly volatile. Today, for instance, KDAUSDT SPOT is estimated as 2.95% volatile. The only thing it means is that you must prepare and examine all available information before making a decision. And if you're not sure about KDAUSDT SPOT, you can find more inspiration in our curated watchlists.
You can discuss KDAUSDT SPOT (KDA) with other users in our public chats, Minds or in the comments to Ideas.