KDAUSDT , going up?Let me know what do you think please like , follow and comment what coin you want to be analysed.
It's not an advice to buy or sell , do your own research
KDAUSDT trade ideas

KDA/USDT 15m timeframe- Continuation of the last KDA chart posted
- There is an inverse head and shoulders forming which is clearer to see on the lined chart rather than the candle chart
- The target if the inverse head and shoulders plans out is around $9.20 as it is the top of the ichimoku cloud

KDA/USDT on a 15m chart- large gap between the conversion line and base line
- bearish TK cross
- support at $8.7 has broken
- potential support at $7.5
- hopefully BTC can just find its bottom and we continue
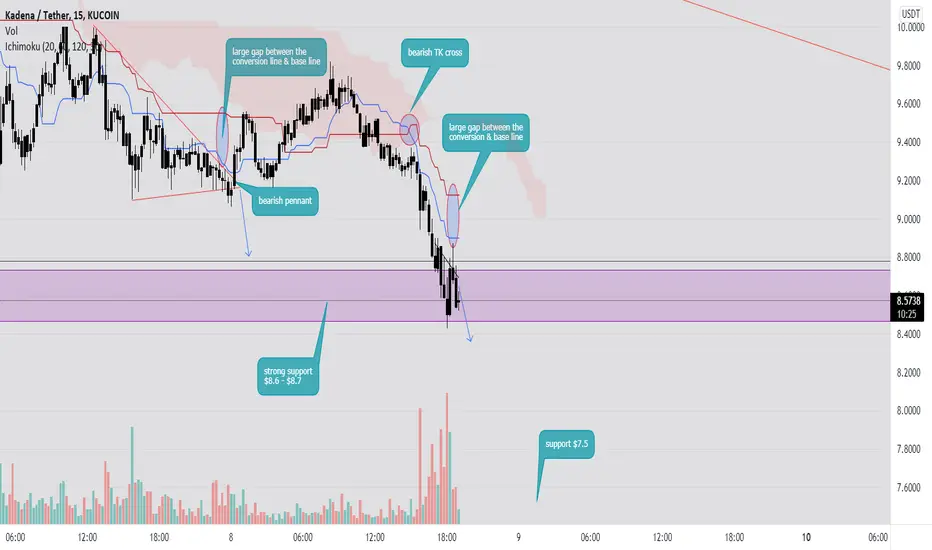
KDA 15m timeframe. is it heading down lower...?- bearish pennant formed
- large gap between the base layer & conversion layer
- strong support on the fib level around $8.8 if the price does drop
- if fib level breaks theres also a strong support around $8.6

KDA 15m timeframe. Bullish or Bearish?mixed signals on the KDA 15m timeframe
- there has been a few candle closes in the red ichimoku cloud which indicates a leg up to the top of the cloud or above
- there is also a bullish TK cross which supports this move up
- but there is a large gap between the conversion line and base line which indicates a move down
- also a double top which supports the idea of a move down
i expect a move up as prices are low, people surely are buying the dip.
but who knows could go either way


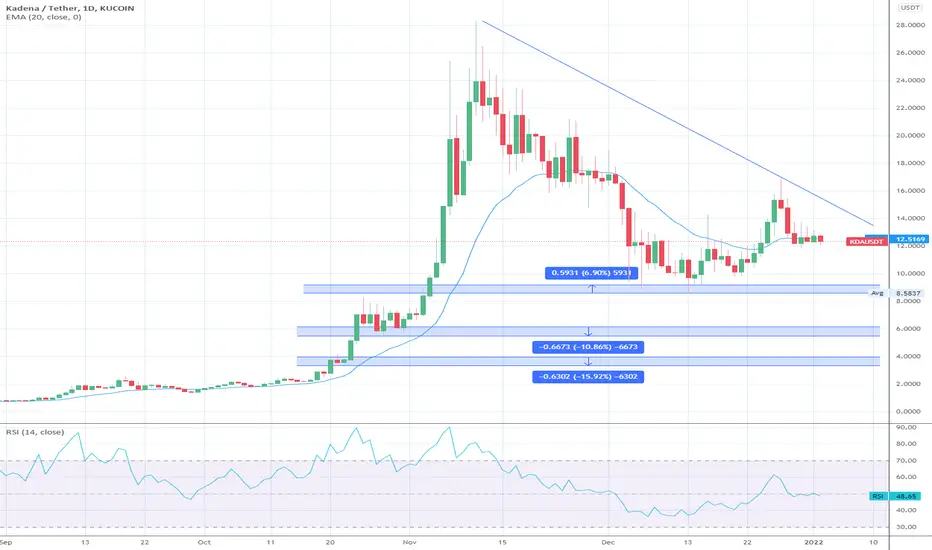
$KDA - Time for Reversal or Keep Going Down?Kadena has had a nice run in November from around $6 all the way to around $28!
However, since its top, we have reached around 60% down from all time highs in November 11th.
Since then, it has been in a consistent downtrend.
However, at these levels, are buyers ready to step up?
We are now sitting in the lower channel on $10.45 - $13.30 range.
For Longs - Need to hold $10 support level.
Ultimately breakout of this channel and create new highs above $12.9.
For Shorts - We would like to stay under $13 resistance level
As well as Breakdown Channel under $10.25.
Let me know what you all think.

KDA/USDT on a 15m chart- double top
- bearish TK cross
- large gap in between the conversion line & base line = bearish
- support around $9.7 may break as its been tested a number of times in the past, however if this does break a support at $8.7 will hold
- thx to BTC for this retracement, also BTC to $42.5k

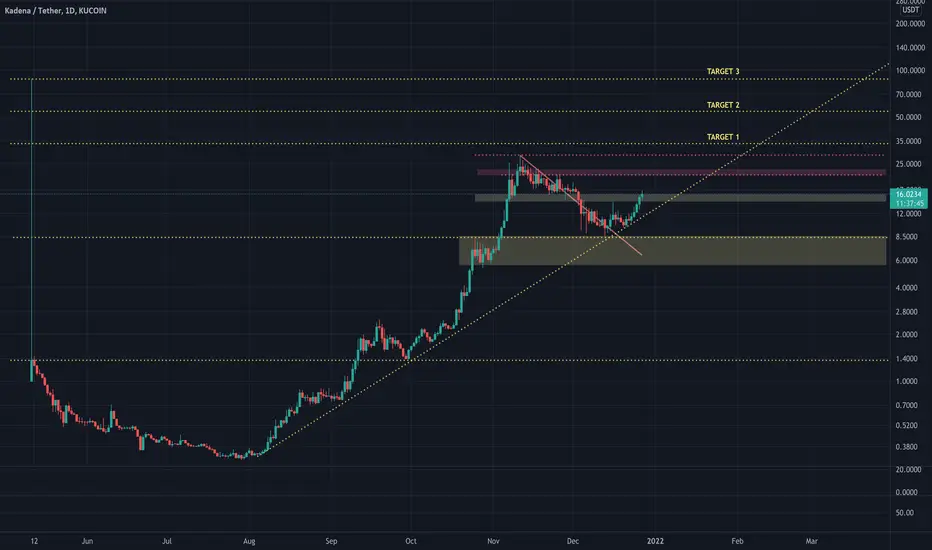
KADENA - EASY SETUP 🚀Kadena is showing us a very simple and easy setup. We had an impulse and now we're in an ABC correction, which will be followed up by another major impulse. Only question is where will the C wave stop.
We have 2 areas where we are looking for the end of C and the start of the impulse.
First area: 8.5 to 9
Double bottom area
Second area: 3.3 to 4
-0.27 fib
Trade Idea:
- Watch for the completion of C wave at one of the 2 areas mentioned
- Enter when bullish price action appears
- Put stops below the rejected price
- Targets: 28 - 33 - Hold the rest
Goodluck!


KDAUSDT Daily TimeframePrevious analysis on 28 Dec invalid. Thus come with this one.
still valid to put into your watchlist of hodl;
- above ema100 (possible entry)
- double bottom?
- bullish engulfing?
#tayor

Mixed signals on the KDA 15m timeframe- bullish RSI
- 2 separate bearish TK crosses
- And a bearish double top
which way will it go?
hoping for a retracement to around $10 and then a leg up, but who knows..

KDAUSDT is creating a falling wedgeKDAUSDT is creating a falling wedge inside the daily structure.
IF the price is going to have a breakout, According to Plancton's strategy (check our Academy ), we can set a nice order
–––––
Follow the Shrimp 🦐
Keep in mind.
🟣 Purple structure -> Monthly structure.
🔴 Red structure -> Weekly structure.
🔵 Blue structure -> Daily structure.
🟡 Yellow structure -> 4h structure.
⚫️ Black structure -> <4h structure.


Breakout confirmed, possible batLike expected the bear flag broke out to the downside, breaking the trendline suport. We had a retest and now its heading further down, perfect for dca.
There is a gap below 9$, so curious to see how kda will react to the previous low. We could bounce back from there, create a double bottem reversal pattern and a possible bat formation suggest we should seek up previous ath.
If the 9$ doesnt offer suport, we will visit the 6$
Timing wise, btc is looking to hit his trendline in 2 weeks, where i expect a bounce. This is the same timing i see for the kda bottem around sunday 16jan.
From there its just pure moon.
Not financial advise, this is pure for my own educational research and backtesting theories.

hight propability to go up it find in the bottom of the channel with a false break out of the support .
first TP the top of the channel.

KDA : CLOSER LOOKSmaller TF to see the support & resistance
.
Good luck n feel free to feedback+ Comment
Possible cup and handle pattern?Kda looks like it's going to do cup and handle on daily time frame.
lets see where it goes
NFA

Kda bear flag breakoutKda was forming a bear flag on the 1H and is currently braking out to the downside. With this breakout is also broke the daily trendline suport to the downside.
Also there is a dead cross on the 4h, wich is bearish too
On the daily, it looks like we are in the 3th correction wave, with wave 2 top at 18$
According to the flag theory, the breakout is as long as the pole, wich gives us a target of 8$ of the 3th correction wave.
8$ is also the top of the monthly buy zone, from 6$ to 8$.
As we have no idea when kda will be listed , wich could trigger a parabolic move, i wouldnt wait to buy kda at the bottem, so im dca. I started at 14$, with 40$ tp1 longterm, but at the moment it looks like we could hit the wife changing money zone of 8$.
Ill add 20% each target.
12$ 10$ 8$ 6$

$KDA hodlers, prepare yourself and hold your hats BTC must not dump, otherwise we will probably test as I showed

KDA/USDTBuy step by step in support. Or if the market does not fall, buy after the resistance breaks.
Like and comment please❤
