KNCBTC trade ideas

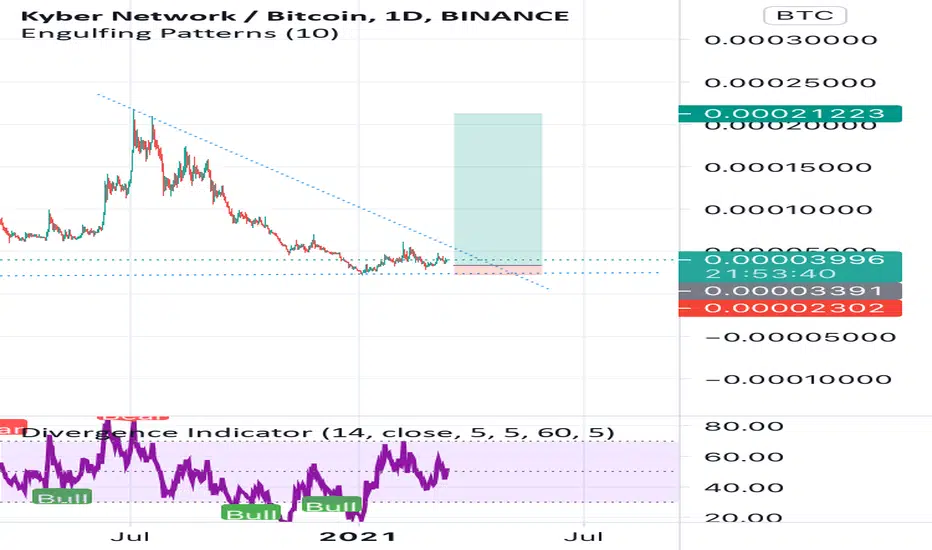
Take profits in a smart wayWe can see that there is a possible 100% upside potential for Kyber network against bitcoin even if this downtrend is finally respected. Maybe a 6-7usd KNC token.. let's see.

KNCBTC - Long - Potential 13.51%KNCBTC - Long - Potential 13.51%
Exchanges: Binance
Signal Type: Regular (Long)
Entry Zone:
0.000062222 - 0.00006347
Take-Profit Targets:
1) 0.00006693
2) 0.00007193
Stop Targets:
1) 0.00006010
Trailing Configuration:
Entry: Percentage (0.0%)

KNC/BTC$KNC Kyber Network / BTC
mainnet beta of Kyber Dynamic Market Maker (DMM) underway.
Making more and more higher highs and lower lows.
Recently broken out of resistance.
Target for now 0.00011142 Sats


KNCBTC - Long - Potential 10.86%KNCBTC - Long - Potential 10.86%
Exchanges: Binance
Signal Type: Regular (Long)
Entry Zone:
0.00005747 - 0.00005950
Take-Profit Targets:
1) 0.00006228
2) 0.00006603
Stop Targets:
1) 0.00005482
Trailing Configuration:
Entry: Percentage (0.0%)

KNC/BTC KYBER NETWORK -1D- CHART H+S Neckline backtest? Or dump?INVERSE Head and Shoulders pattern confirmed and neckline was broken and is in process of confirming. A bullish engulfing candle would solidify (on above average volume) that this has legs. Given the market sentiment on alts being extremely favorable as well as the BTC.D head and shoulders being confirmed, I would think this chart has a lot to say for KNC 3x-BTC valuation happening. The only thing about this pairing is on the weekly MACD chart - is it topping out or just revving up for a much higher evaluation despite the bearish convergence from it's last pivot high? (marked on this chart as 0 fib node). we shall see. put in a stop loss just below the neckline if worried.
Good Luck!

Time to invest in KNC.... for sure... checkout supports.... fibonacci near 61% .... trendlines bounce... I am in LONG :D

KNC/BTC READY WITH 350% BULLISH POTENTIALKNC/BTC
Current Price = 0.00005123
Pump Potential = 350%
Period = 30 to 60 to 90 Days
After a huge falling wedge KNC/BTC now breaks its wedge and make a new symmetrical triangle and trying to pull up its price.
Technical Analysis
1. KNC/BTC breaks its huge falling wedge
2. Golden Cross (50 EMA cross over 200 EMA at 4H Chart)
3. Trading Above 200EMA at 4H Chart
4. Bullish divergence at RSI
5. Retest from All Time Low
You can take entry in it for a very good ROI for at least 30 to 90 days.
Thanks & Happy Trading


Kyber bullish and ready for 200% short term, 400% mid term.KNCBTC looks like it has finished it's long term downward trend and is very bullish like many alt coins now. I can see a clear bullish flag forming with a strong upward movement to come.
This is not financial advice.
Good luck and happy trading!


$KNC, Breaking above ~4800 sats w/ increasing volume $KNC
Breaking above ~4800 sats w/ increasing volume & UCTS 1D/2D buy signals
Bot took the entry & now trying to see if its able to hodl/flip this level for further continuation..
Upside looks quite massive if gets momentum, 2020 highs are over ~300%
Let see how it goes!
#KNC

💡KNC: BUY Trade🚀🚀🚀🚀🚀🚀 #ALTSEASON2021📈#KNCBTC
➡️Entry: 3500 sat
🎯Target 1: 4350 sat
🎯Target 2: 5260 sat
🎯Target 3: OPEN

knc btc big things comingThis could potentially outperform most of the altcoins.
The fundamentals are there, kyber 3.0 incoming.
The technicals are even better:
On small tf 4h: Inverse head and shoulders completing
volume breakout
rising rsi
macd looks good
On the bigger tf:
There is also a big inverse head and shoulders. The small tf reversal could propel the price to the bigger neckline, then we could have a small rejection there, before shooting very high.
ZRX/USD had a similar fractal pattern like this one, before exploding an astonishing 200+% in a week.
Obviously past performance doesn't have to imply it's gonna happen the same in this case, but often human behaviour is reflected the same way in every chart, that's why similarities are found.
Check out my other posts if you like this one.
Remember this is just an idea, always do your research before investing.


KNC BTCmassive 500 percent move coming to KNC BTC. KNC ready to explode with 3.0 upgrade. DYOR.
KNC’s time to join the bull cycle.
Buy the dip and hold your breath KNCYOUR LIKE OR COMMENT IS MY FUEL FOR NEXT ANALYSIS :)
This is not a financial advice. Always do your own research and always put stoploss in your trade (SL) :) If you want more detailed info how to study and read charts or just need help with some coin, just write to me here a comment, i will try to answer to everybody... i can help you :) all for free, don't worry, BE HAPPY!
If u like the analysis, please feel free to ask any question about this TA or crypto or any coin - leave a comment or like or share the idea, i really appreciate it because then my work makes sense :) thanks!
