Is it DEAD? Current situation:
1. There were very bearish signs as I have mentioned in my previous, where there was a head and shoulders pattern inside a bearish symmetrical triangle. The head and shoulders pattern broke out and met its measured target. Now, the price action is being supported by the daily 200 moving average. But the symmetrical triangle was broken as well apparently and the measured target for that is about 0.75
If we break down below the daily 200, we will be under all major moving averages on this chart. In that case, these moving averages will act as resistance for price action getting back up. Depending on the distance between these moving averages, it could be a bumpy ride back up. If the distances between each of the moving averages then are small, it may be smoother because then price action can break multiple at once instead of each one by one, where the latter takes more time.
2. Volume: seller looks like it's still trending up with lower price action, signaling seller strength is still strong.
3. RSI: not quite oversold on many of the bigger timeframes and bullish is not apparent from the 4HR timeframe up. So I do not see a sign of reversal here on the RSI yet.
* These are purely my speculations and not financial advice. You should always do your own due diligence before trading or investing.
KNCUSD trade ideas

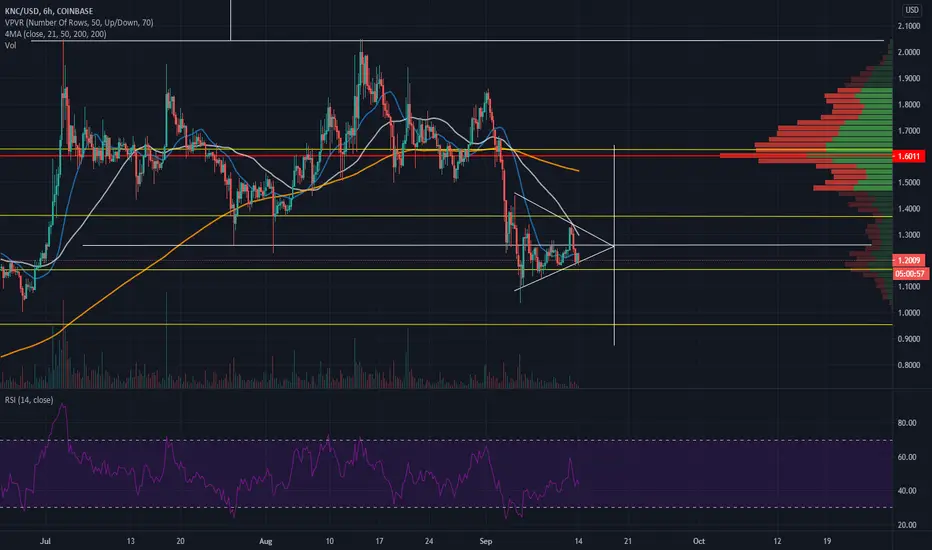
KNC BULL GARTLEY TARGET: $1.06 ENTRY, $1.44 1ST TGT, $1.95MOONKNC BULLISH GARTLEY TARGETS. AMONGST THE SELL OFF. TARGETING KNC FOR A LONG WITH A $1.06 ENTRY, $1.44 1ST TARGET & $1.95 AS A MOON TARGET. IF IT DOESN'T HIT THE $1.06...I'M NOT BUYING. MOVE ON TO THE NEXT OPPORTUNITY

Looking VERY BEARISH with these signs but will it go up instead?The current situation:
1. On the 4HR chart, there is a head and shoulders pattern apparent with the neckline at about 1.18 and it seems like price action has already broken through that neckline currently. The measured move is about 1.02, which is also where the daily 200 moving average is and can act as support for the breakdown.
Also, if we zoom out to the daily chart, we can see that the head and shoulders pattern is part of a bigger bearish symmetrical triangle pattern. The measured target of that triangle is now about 0.75
2. Volume: seller volume has been steady and is most apparent on the daily chart. This is not a good sign for a reversal to upward price action as it does not indicate seller strength is weakening.
3. RSI: it is oversold on the hourly, with clear bullish divergence on the 1 and 4HR charts. This could be a catalyst for a reversal on these time frames IF they play out.
The bullish case:
1. Price action does at least need to get back on top of 1.16 and the hourly 21 moving average to make a case to even start looking bullish.
The bearish case:
1. The next level down where there was a bounce was about 1.10, if this level is broken, it will convince me that the symmetrical triangle has been broken. If the daily 200 moving average is also broken with price action start closing below 1, that will be a very bearish sign.
* These are purely my speculations and not financial advice. You should always do your own due diligence before trading or investing.

KEY resistance level to break for a bullish breakoutThe current situation:
1. Market structure: price action is in a bearish symmetrical triangle, with the upside target to be about 1.6 and the downside target to be about 0.85. In order for a convincing case of bullish breakout to happen, the price does need to get over the 6HR 50 moving average currently sitting at about 1.26, which we have not been able to close above. A close above this resistance level will be a more convincing case that price action may break out upwards. However, do note that there are still quite a bit of resistance between the breakout and the target, such as the daily 21 moving average currently at about 1.4.
Price action has also been able to stay above the 3D 50 moving average with more bullish candles.
2. I would also pay attention to BTC price action as well, since a drop in BTC can also affect altcoin price action. However, it does look like BTC is making a recover since the dump.
** These are purely my speculations and not financial advice. You should always do your own due diligence before trading or investing.

Bigger bearish symmetrical triangle formed - signals to watchThe current scenario:
1. Market structure: price action previously broke out of a symmetrical triangle with the measured target to be about 1.6 USD (see my previous posts) but have failed to reach the target. After being rejected by the 6HR 50 moving average, price action has gone to as low as 1.18 and now formed a bigger bearish symmetrical triangle. The upside measured target from the apex of this symmetrical triangle is about 1.65 and the downside measured target is at about 0.87. It is also important to note that we starting this week's candle under the 21 moving average and the immediate support we have is the 3D 50 moving average. Breaking below the 3D 50 moving average will be a BAD sign so I would watch this level.
2. BTC dominance is currently reversing back up to about 60% and is at the 6HR 21 and 50 moving average. If this does not get rejected at those moving averages, more upside on BTC.D will mean altcoins are going to take a further hit overall. So it is very important to watch where BTC.D trends in my opinion.
3. RSI: there is currently bullish divergence on the hourly chart, let's see if this plays out and starts an upswing to the upper trend line of this triangle.
The bullish case:
1. The 6HR 50 moving average, which was the previous resistance is now coming down and currently sitting at about 1.3. If we get price action above this moving average, it is a good sign for the bulls as the next moving average that will act as resistance is the daily 21 moving average currently at about 1.42.
The bearish case:
1. The 3D candle closes below the 3D 50 moving average as that has been the support since the dump.
* These are purely my speculations and not financial advice. You should always do your own due diligence before trading or investing.
Kyber Network (KNC) - September 13Hello?
Dear traders, nice to meet you.
"Like" is a huge force for me.
By "following" you can always get new information quickly.
Thank you for always supporting me.
-------------------------------------------------- -----
It rose after touching the uptrend line (2) and the 1.05435354 point.
You need to make sure you can get support at the 1.26937200 point.
Breaking the downtrend line (4), it remains to be seen if it can move above the 1.43039721 point.
If it falls from the uptrend line (2), it is a short-term Stop Loss.
-------------------------------------------------- -------------------------------------------
** Check support, resistance, and abbreviation points.
** Support or resistance is based on the closing price of the 1D chart.
** All explanations are for reference only and do not guarantee profit or loss on investment.
Explanation of abbreviations displayed on the chart
R: A point or section of resistance that requires a response to preserve profits
S-L: Stop-Loss point or section
S: A point or segment that can be bought for generating profit as a support point or segment
(Short-term Stop Loss can be said to be a point where profits and losses can be preserved or additionally entered through installment trading. You must trade from a short-term investment perspective.)

BREAKOUT success - here's the next level of resistanceThe current situation:
1. Price action broke out of the smaller symmetrical triangle that should have been a continuation of the breakout of the larger symmetrical triangle on 9/9. The next level of resistance is the 6HR 50 moving average currently sitting at about 1.35
2. On the daily chart, it seems more apparent to me that this is indeed the recovery and I would expect more buyer volume to show up on the daily for more upward price action.
3. The RSI is in overbought territory on the hourly so I predict a pullback at 1.35 where the 6HR 50 moving average is.
*These are purely my speculations and are not financial advice. You should always do your own due diligence before trading or investing.

Another move can be coming very soon after THIS level breaksThe bullish case:
1. Market structure: price action broke out of a bigger symmetrical triangle on 9/9 but has still yet to be reached as there are still quite a bit resistance levels to get over. Price action is now apparently in a smaller bullish symmetrical triangle, which has a 60% chance of breaking upwards. The level it needs to break out of in order for this pattern to be seen as broken is currently at about 1.24, which is also where the 1HR 200 and 4HR 50 moving average is now. The measured move of the breakout upwards is about 1.35 USD.
2. RSI: not overbought in any timeframe from the 1HR to the weekly, so there's room for upward price action.
The bearish case:
1. The price action breaks downward at the apex of the triangle. If that case plays out, the measured move is about 1.1 USD. It's also possible that the price action continues to run in a tight range delaying a breakout
*These are purely my speculations and are not financial advice. You should always do your own due diligence before trading or investing.

BIG move could be coming soon - very bearish if this breaksThe bearish case:
1. Price action is currently in a symmetrical triangle pattern, which continues in the direction it started at 60% so more downward action is expected by chance. Currently, the price action has not bounced off the 21 weekly moving average, which is at about 1.2 right now. The measured move of the breakdown is about 0.75USD.
2. Bitcoin dominance is currently at 60.77%, which is right under the 21 daily moving average. If the daily candle closes above the daily moving average, that is also a bearish indicator for KNC and altcoins in general.
The bullish case:
1. On the 4HR chart, it is clear that we are seeing more buyer volume comparing to sellers so that could be a sign that buyers can come in for a break out of this pattern.
2. There is bullish divergence on the daily chart. If this plays out and the price action gets back above the weekly 21 moving average then we can expect more upward price action.

Broke out of THIS bearish pattern, cautiously bullishCurrent Situation:
1. Market Structure: broke out of a bearish symmetrical triangle and now it has a measured move of about 1.6 USD. There are still quite a bit of moving averages and the previous support now resistance of about 1.25. BTC dominance currently is under all moving averages on the major timeframes up to the weekly, which could be a good signal for altcoins to run up.
2. Volume: seller volume has been trending down on the daily chart, which signals weakening seller strength and that this move could be a bounce or trend reversal.
3. RSI: we are under 50 for all major timeframes that are available to interpret. There is also bullish divergence on the daily chart.

STILL bullish on KNCUSD but the bottom trend line needs to holdThe bullish case:
1. Market structure: the inverse head and shoulders along with the ascending triangle pattern is still holding. But the price action is currently near the bottom trend line so I would keep a close eye out on it.
2. Volume: seller volume has decreased and is most apparent on the 4 and 6HR timeframe, This could be the signal for a trend reversal as sell pressure becomes weaker if seller volume does not start trending up again with lower price action.
3. RSI: there is currently bullish divergence on the 6HR timeframe. It can also occur soon at the the 1 and 4HR timeframe if the price goes down to about 1.59 USD.
The bearish case:
1. The price action breaks the lower trend line and the next level of real support will be 1.50 and then 1.40, which is where the 12HR 200 moving average is currently sitting.

SLIGHT bullish but look out for these pointsCurrent Scenario:
1. Market structure: price action is currently in a rectangle pattern, which is a neutral pattern so it can go either way. The weekly 21 moving average is currently at 1.19 USD, which is about right underneath the bottom trend line right now, which should confirm that the bottom trend line can temporarily serve as support.
2. Volume: there is no clear trend on the past 3 days' downward price action candles, especially with the volume on the candle close yesterday 9/3 increasing from the day before.
3. RSI: on all major timeframes are either at about 50 or lower, which signals a reversal could come.
The Bullish Case:
1. Price action has to at least get a solid close above the 12HR 200 moving average, currently at 1.41, in order to convince that we are reversing towards the top trend line .
2. On the weekly chart, a convincing signal that the pattern can break upwards will be either if this week's candle closes green OR at least with a longer wick than the 7/20 weekly candle. This will signal that we are getting more buyers at the bottom trend line .
The Bearish Case:
1. In my observation, BTC price action affects most altcoins. If BTC continues to drop , I would predict more downward action.
2. The price action breaches the weekly 21MA and close this week below it.


KNC back in business?If BTC:USD can keep its shit together we can Expect KNC back at 1.60 easily by the end of the week

It’s still within the ol’ triangle.I see people getting worried, but as long as it stays within this until the end there should be no reason to freak out....right? Lol. Opinions?


KNC/USD 4HRFirst resistance will be bottom of the horizontal channel then purple line. We've wicked and closed above the purple support line. We will see once ocsilators reset if we hold support.
We have seen 3-4 different patterns in the horizontal channel that were simultaneously trying to play out.
In horizontal channel (continuation)
-Ascending triangle (Bullish)
-Inverse H&S (Bullish)
-H&S (Bearish)
-Double Top (Bearish)
I believe the double top at 2.05 sealed the bearish down break we've seen and couldn't get back out there for a 3rd touch at 2.05 and capped out at 1.86
Comment idea below.

KNC/USD 1DMajor support uprising trend line (purple uptrend line) almost oversold on Daily RSI. If we break this support, then we will crash to $1.
Comment below ideas of this uptrend line.

KNC/USD 1DTrading in parallel channel on the daily. Comment thoughts for all my Kyber people out there. As you know, we broke support for our ascending triangle which was beautiful. Now we are at the bottom of the parallel channel . With 4Hr RSI oversold and Daily approaching oversold.

Wave Count...This is quite a brilliant chart in how smooth the transitions have been 5 waves up and 3 down (if you can count them properly), this may be setting up for a larger wave 3 which could push price extremely high.

KNC on supportGood buy on support, Expecting a nice breakout of this triangel. Do we hold this support and breaking out We can easy see 3$


