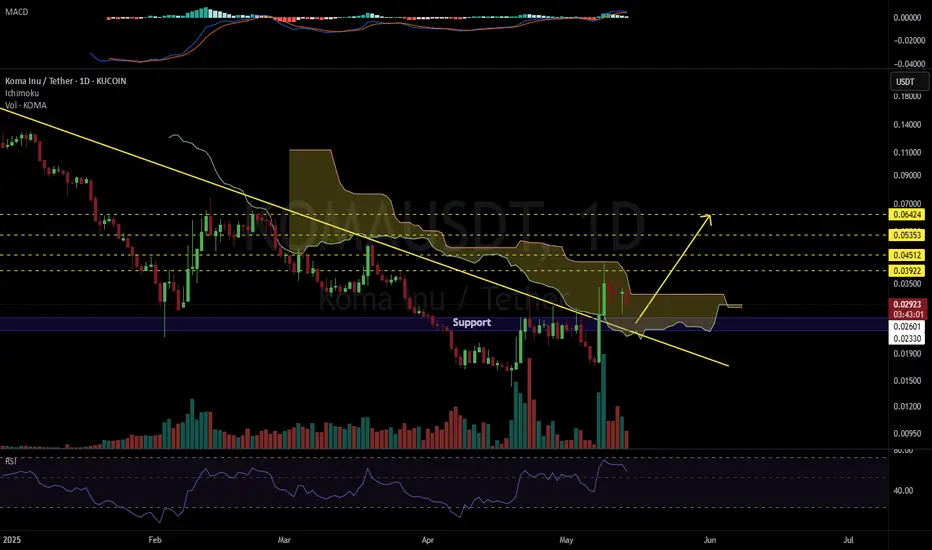
KOMAUSDT 1D#KOMA has broken above the descending resistance on the daily chart. It even entered the Ichimoku cloud but hasn’t been able to break out of it yet and is currently moving inside the cloud. Consider buying some #KOMA between $0.02601 and $0.02330.
In case of a breakout above the Ichimoku cloud, the targets are:
🎯 $0.03922
🎯 $0.04512
🎯 $0.05353
🎯 $0.06424
⚠️ Use a tight stop-loss.
KOMAUSDT trade ideas
KOMAUSDT 1D Analysis KOMA ~ 1D Analysis
#KOMA di This trade is very high risk
Buy gradually on this support block with a short-term target of at least 10%++

Good KOMA growth potentialAt the end of last week, I recommended keeping KOMA memcoin in mind as having a very high growth potential, as it is only at the development stage. Against the background of a new wave of growth in the second half of this week, we can expect much stronger growth. The minimum goal is to consolidate above the key level of 0.05, which will open the possibility of continuing the trend to the range of 0.075-100. With sufficient volatility, there is a chance of a breakdown immediately to the 0.1 test.
In addition to koma, I am considering chess and fio for work. Also on the weekend, a bul run on fantokens up to 3-5X atm city acm is likely.

KOMAUSDT CHART ANALYSİS - EDUCATIONAL POSTHow NFT Technology Developed
NFT technology was created in 2017 based on Ethereum smart contracts. Since then, we have witnessed many successful NFT projects and deals. Stories like these perfectly describe the current and future possibilities of the technology.
The development of blockchain technology and the emergence of NFT services coincided with other processes in society and the economy. Many new players appeared in the stock markets, including non-professional traders and amateur investors.
The democratization of financial markets coincided with the pandemic: being in self-isolation, alone with their devices, many people began to pay attention to new financial instruments.
The information that arose around them also played a specific role in the “revival” of NFTs. The big names in the news headlines supporting NFTs couldn’t help but draw attention to them. That is one of the reasons why the success of the technology was inevitable.

170% rally for Koma INU ??Requested TA, more than once.
On the above daily chart price action has dropped over 80% since early December. A number of reasons now exist for a long position, they include:
1) Price action and RSI resistance breakouts.
2) Volume, a lot of new volume. See MFI breakout.
3) Reversal / hammer candle.
4) Resistances as shown, first 170% above. After that, blue sky.
Is it possible for price action to correct further? Sure.
Is it probable? No.
Ww
Type: trade
Risk: high, tiny market cap
Timeframe for long: sooner than you think
Forecast: 170%

KOMA/USDT Quick Scalp Long On DumpOn this Small Market Correction. We utilising the opportunity to open a small long scalp on meme coin. Let's Try to Print This.

KOMA/USDTKey Level Zone : 0.15617-0.15873
HMT v3.0 detected. The setup looks promising, supported by a previous upward/downward trend with increasing volume and momentum, presenting an excellent reward-to-risk opportunity.
HMT (High Momentum Trending):
HMT is based on trend, momentum, volume, and market structure across multiple timeframes. It highlights setups with strong potential for upward movement and higher rewards.
Whenever I spot a signal for my own trading, I’ll share it. Please note that conducting a comprehensive analysis on a single timeframe chart can be quite challenging and sometimes confusing. I appreciate your understanding of the effort involved.
If you find this signal/analysis meaningful, kindly like and share it.
Thank you for your support~
Sharing this with love!
HMT v2.0:
- Major update to the Momentum indicator
- Reduced false signals from inaccurate momentum detection
- New screener with improved accuracy and fewer signals
HMT v3.0:
- Added liquidity factor to enhance trend continuation
- Improved potential for momentum-based plays
- Increased winning probability by reducing entries during peaks

KOMA sell/short setup (2H)KOMA is approaching a supply zone.
Upon reaching this zone, we expect a price rejection.
The targets are listed on the chart.
The closure of a 4-hour candle above the invalidation level will invalidate this analysis.
For risk management, please don't forget stop loss and capital management
Comment if you have any questions
Thank You
