5 Bearish Signals —Bitcoin CME Gap (91,970 - 92,525)Bitcoin's bearish bias is confirmed clearly. Bearish signals are starting to pile up one on top of the other, let's recap those real quick:
1) Bitcoin is trading below its December 2024 high, it's January 2025 peak price and the recent 22-May all-time high. Trading below these levels open the doors
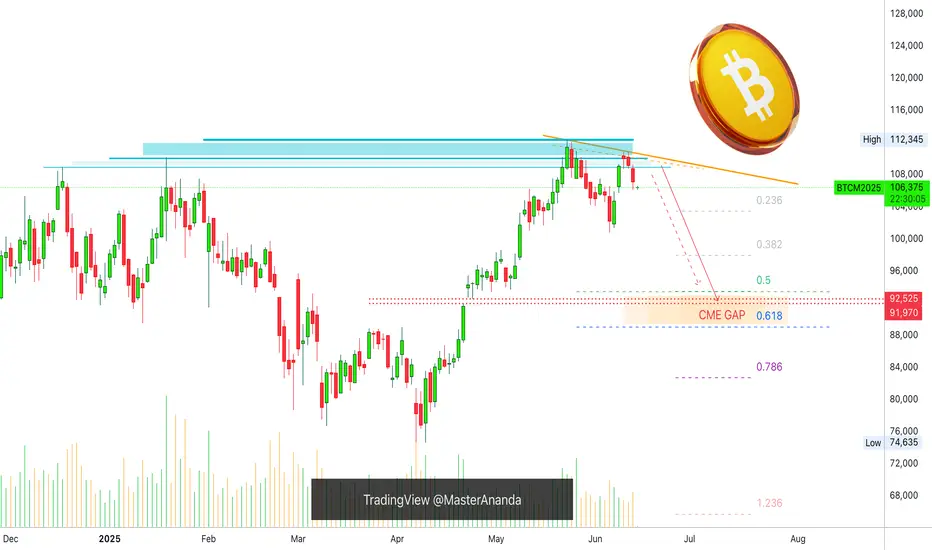
Chart Pattern Analysis Of Bitcoin
There are 4-5 candles consolidate around the resistance,
And the demands keep decreasing.
Compared to K3,
the demand at K4 increased, but it failed to close upon K3.
If K5 is a doji candle close at low price area,
Or,If K5 starts with a bear gap to close below K4,
It is likely that the following

BITCOIN (BTC) Analysis For The WeekI've been studying BTC and others and want to share my analysis. Trading involves probabilities, so it's essential to be confident and prepared. Study the market thoroughly before trading with real money.
Let's test strategies this week. You may use a live account if you have capital, and manage you

Bitcoin Symmetrical Triangle & another pattern formingBTC is currently trading in a Symmetrical Triangle formation.
This is generally a continuation pattern.
There's also a longer term BTC pattern FORMING.
Do you see it?
Inverse Head & Shoulder.
But it is a ways off, time will tell.
Bitcoin Crypto

ETH ShortETH & BTC have similar POIs but BTC approaching much sooner. I think BTC could go higher, allowing ETH to push into the zone and simultaneously creating BOS for BTC which would then turn into another opportunity (for Buys) later

Bitcoin’s Bearish Signal: Key Levels to WatchFenzoFx—Bitcoin consolidates near $104,225 after breaking below the bullish trendline, signaling a possible break of structure. This level acts as immediate support, and a bearish wave could form if BTC closes below it, targeting the $101,880 demand zone.
The bearish outlook remains valid unless Bi

MBT! - Risk reward in favour for longs!After taking continuous supports from AVWAP there is bullish bias in Bitcoin. We remain in a higher high, higher low structure on every time frame from D to H1. Each pivot breakout(marked in green) will be opportunity to add more to your positions.
BTC 2H#BTC
All Eyes on the CME Gap: $101,390 – $100,880 📉
Given the heightened geopolitical tensions between Iran and Israel, market volatility remains elevated.
🎯 There’s a strong probability this gap will be filled.
⚠️ Trade cautiously and always use a stop-loss to protect your capital.

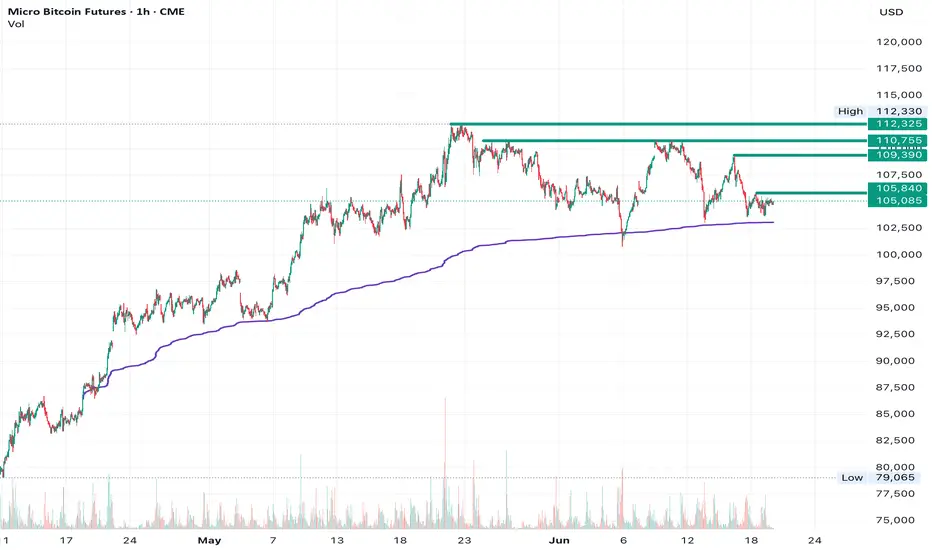
Micro Bitcoin Futures-MBTCME:MBT1! I’ve entered a short position on Micro Bitcoin Futures (MBT1!) based on a potential mean reversion setup.
Price recently touched the upper Bollinger Band and met resistance near the 109–110 zone. Given the overextension and slowing momentum, I’m anticipating a pullback toward the lower b

Bitcoin Update + Bitcoin CME Gap CONFLUENCE
POSTING FOR AWARENESS NOT TO PANIC Y'ALL, True trader will be optimistic as always and can play both sides of market. 💯
Just incase PBr1 won't hold as aggressive bounce base on my recent update, Since nandun ang possible aggressive volume sa short term PBr1 for possible breakout sa ATH i just want

See all ideas
Summarizing what the indicators are suggesting.
Oscillators
Neutral
SellBuy
Strong sellStrong buy
Strong sellSellNeutralBuyStrong buy
Oscillators
Neutral
SellBuy
Strong sellStrong buy
Strong sellSellNeutralBuyStrong buy
Summary
Neutral
SellBuy
Strong sellStrong buy
Strong sellSellNeutralBuyStrong buy
Summary
Neutral
SellBuy
Strong sellStrong buy
Strong sellSellNeutralBuyStrong buy
Summary
Neutral
SellBuy
Strong sellStrong buy
Strong sellSellNeutralBuyStrong buy
Moving Averages
Neutral
SellBuy
Strong sellStrong buy
Strong sellSellNeutralBuyStrong buy
Moving Averages
Neutral
SellBuy
Strong sellStrong buy
Strong sellSellNeutralBuyStrong buy
Displays a symbol's price movements over previous years to identify recurring trends.
Related futures
Frequently Asked Questions
The current price of BTCUSD Single Collateral Futures Contract is 103,760.5 USD — it has fallen −0.44% in the past 24 hours. Watch BTCUSD Single Collateral Futures Contract price in more detail on the chart.
The volume of BTCUSD Single Collateral Futures Contract is 16.93 K. Track more important stats on the BTCUSD Single Collateral Futures Contract chart.
The nearest expiration date for BTCUSD Single Collateral Futures Contract is Jun 27, 2025.
Traders prefer to sell futures contracts when they've already made money on the investment, but still have plenty of time left before the expiration date. Thus, many consider it a good option to sell BTCUSD Single Collateral Futures Contract before Jun 27, 2025.
Buying or selling futures contracts depends on many factors: season, underlying commodity, your own trading strategy. So mostly it's up to you, but if you look for some certain calculations to take into account, you can study technical analysis for BTCUSD Single Collateral Futures Contract. Today its technical rating is sell, but remember that market conditions change all the time, so it's always crucial to do your own research. See more of BTCUSD Single Collateral Futures Contract technicals for a more comprehensive analysis.