KSMUSDT - 1h Long Signal💡💡#SIGNAL 💡💡
KSM / USDT
▶️ Buy NOW
🔴 SLT - 1h (Trigger)
Very small stop
#KSMUSDT_1h_170622
KSMUSDT.P trade ideas

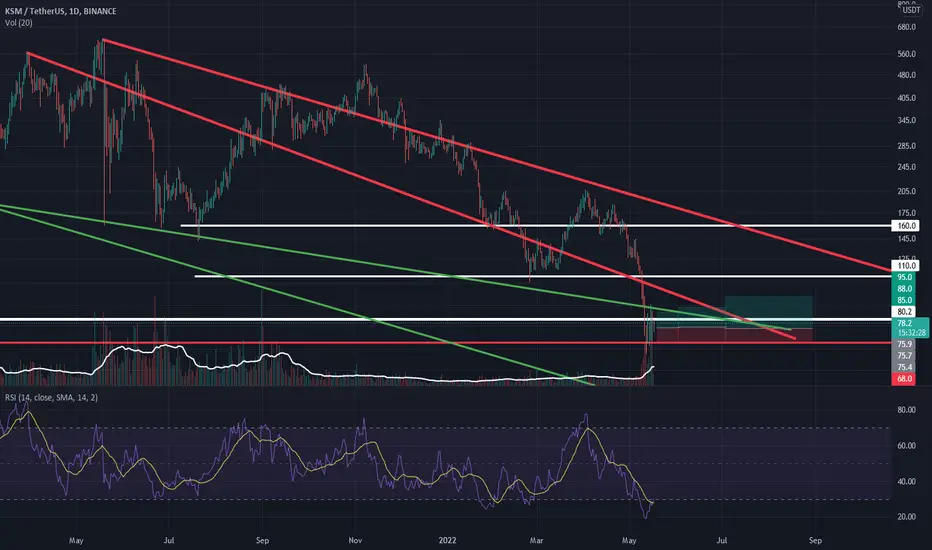
KSM - some possible paths it'll takeNot wanting for it to look messy but thinking about all the different paths KSM could take.
1. test of the lower support and up and breakout.
2. breakdown of lower support and then back inside the wedge for a nice bullish deviation.
3. a simple break out to the downside, retest and continuation down.
Watch this space.
Lower support could be good for a long, with tight stop loss.

KSM Short SignalKSM Short Signal
KSM has pumped but the pump has stopped and we can get a Short position on it
Targets are $46 and $44

#KSMUSDT 2H Chart
Price is currently retesting the daily demand zone after getting rejected from the 3h supply at $58. MACD is showing bearish momentum, RSI and EMAs are neutral. If price breaks once again below this demand zone, then i would expect further downward movements from here.

KSM Beatiful trendline breakout + Bounce from supportReasons to take short
⭐️ Buyer on BTC
⭐️ We came to liquidity zone
⭐️ Volume increased
⭐️ Price is squeezing to the trendline
⭐️ 3rd touch of support
⭐️ 130 ATR
Will enter when price squeezes to the trendline on 5m timeframe, the base will form and the tape will get faster.
If you don't understand the previous sentence, just use swing stop-loss 3-5%
Fix profit by parts:
1% - 1/3
2% - 1/3, stoploss to breakeven
What's left, hold to the maximum
What do you think of this idea? What is your opinion? Share it in the comments📄🖌
If you like the idea, please give it a like. This is the best "Thank you!" for the author 😊
P.S. Always do your own analysis before a trade. Put a stop loss. Fix profit in parts. Withdraw profits in fiat and reward yourself and your loved ones

KSMUSDT its volume seems to has spiked hard🚨 Look‼️☝️KUSAMA's volume seems to has spiked hard, lately while it shaped with a doji on multiples timeframe⌛
🚨========🚨
Positive volume: Which we shall look further of a 2.0 risk/reward ratio
Target : 56.62$
resistance : 53.72$
Stoploss : 46.68
🚨========🚨


#KSMUSDT 3H Chart
Price is currently testing the major daily demand zone after dropping and leaving a couple of supply zone at $57 and $66 with imbalances in the market around $56 and $65 respectively. MACD is showing bearish weakness, RSI is oversold and EMAs are bearish. I expect price to move up towards the first supply zone at least before moving down again however we shall wait for confirmation once price taps into it.

KSM Long HOLD - HopiumI bull case for Long term KSM.
Good support between $100-$120. Good area to accumulate and hodl.
If it breaks down, next best buy zone is $50-$70.
Bearish on short term.
Bullish on long term.

KSM/USDTKSM / USDT
Located in a descending channel.
An upward divergence is forming at the bottom of the channel.
It is expected to fall in the range of $ 55 and then rise to $ 90.
#KSM #KSMUSDT #BTC #BTCUSD #LUNA #LUNC #UST


KSM |Kusama | Range Trading MovementKSM |Kusama | Range Trading Movement
Kusama is showing a bullish scenario for a range trading movement.
After the price was tested the lower support area close to 65 it should
faces strong support from the lower part of the structure.
I am expecting the price to move higher again.

#KSMUSDT 4H Chart
Price is currently consolidating inside the 4h demand zone with no major movements. MACD lines are preparing to cross and become bullish, RSI is sold and EMAs are bearish. I expect price to move up from here to fill the imbalance around $78 and reach the 1h supply at $82 before moving down again. Waiting for confirmation coming into next week.

Kusama (KSM) formed bullish Gartley for upto 2157% massive rallyHi dear friends, hope you are well and welcome to the new trade seutp of Kusama ( KSM ) coin.
On a monthly time frame chart, KSM has formed a huge bullish Gartley pattern.
Note: Above idea is for educational purpose only. It is advised to diversify and strictly follow the stop loss, and don't get stuck with trade

#KSM/USDT 4HOUR UPDATE !Hello dear traders, we are new here so we ask you to support your ideas with your LIKE and COMMENT, feel free to ask any questions in the comments, and we will try to answer for all, thanks, Friends.
I have tried my best to get the best possible results in this chart.
Hello, dear traders welcome to this KSM/USDT 4Hour chart analysis.
KSM/USDT LONG TRADE SETUP
ENTRY:-$65,$67.5
TARGET:-40%
STOPLOSS:-$62.4
LEVERAGE:-10X TO. 20X
Remember:-This is not a piece of financial advice. All investment made by me is at my own risk and I am held responsible for my own profit and losses. So, do your own research before investing in this trade.
Happy trading.
Sorry for my English it is not my native language.
Do hit the like button if you like it and share your charts in the comments section.
Thank you.

KSMUSDT PLAN UPDATEshort plan was shared here yesterday, going exactly as planned, targeting range low, congrats if u got in on it


KSM - Update of the previous short ideaAs we can see trendline was extended which makes our setup only better.
Reasons to take short:
⭐️ BTC bearish
⭐️ Global market is bearish
⭐️ Global trend is bearish
⭐️ Trendline is seen on multiple timeframes
⭐️ 6th touch
⭐️ Trendline is 7 days old
⭐️ Bulls were trapped yesterday
⭐️ Under VWAP
⭐️ 34 ATR
Will enter when price squeezes to the level on lower timeframes, the base will form and the strip will get faster.
Fix profit by parts:
1% - 1/3
2% - 1/3, stoploss to breakeven
What's left, hold to the maximum
What do you think of this idea? What is your opinion? Share it in the comments📄🖌
If you like the idea, please give it a like. This is the best "Thank you!" for the author 😊
P.S. Always do your own analysis before a trade. Put a stop loss. Fix profit in parts. Withdraw profits in fiat and reward yourself and your loved ones

KSM - Short term short4H candle is forming a doji. This gives us a potential good short setup with a tight stop loss at the high. 1.5 RR ratio.

KSM/USDT-1D-BINANCEThis is not a financial advice. Always do your own research and always put stoploss in your trade (SL) :) If you want more detailed info
how to study and read charts or just need help with some coin, just write to me here a comment, i will try to answer to everybody...
i can help you :) all for free, don't worry, BE HAPPY!
KSMUSDTHello Crypto Lovers,
Mars Signals team wishes you high profits.
This is a one-day-time frame analysis for KSMUSDT
You see that the price touched its previous support line and at the moment it is fluctuating below this line. We believe this is a failure in break and the price is able to move over the lost support line again and have more increase. Also, it is probable that the price will have a pull back and move downward to the support line and face more decline.
Warning: This is just a suggestion and we do not guarantee profits. We advise you analyze the chart before opening any position.
Wish you luck

KSM - Easiest short of my life <3Nearly perfect situation for short. Especially good is a boner-candle that killed a lot of shorts and trapped bulls. After longer accumualtion I will enter the position. Right now pullback is possible
Reasons to take short:
⭐️ BTC bearish
⭐️ Global market is bearish
⭐️ Global trend is bearish
⭐️ Trendline is seen on multiple timeframes
⭐️ 4th touch
⭐️Bears got liquidated recently
⭐️ Under VWAP
⭐️55 ATR
What do you think of this idea? What is your opinion? Share it in the comments📄🖌
If you like the idea, please give it a like. This is the best "Thank you!" for the author 😊
P.S. Always do your own analysis before a trade. Put a stop loss. Fix profit in parts. Withdraw profits in fiat and reward yourself and your loved ones
