KSMUSDT LONG/ SHORTKSM is at an easy buy zone btwn 35 to 38
If holding with relaxed leverage KSM can give u a nice profit till 70$
Market is unstable so plz use low Leverage....
MonthEND nearing so anything can happen ...
You can even wait for monthly open n verify n Long....
70 $ is for sure
Never a Financial Adi.... Plz handle Money properly...
Do ur research n stick to ur strategy
Trade Safe ....
If you wana give me any tips, plz feel free to comment .....
KSMUSDT trade ideas

KSMUSDT 6HKSMUSDT 6H
Keep investigating your price fairness band, right now in the formation of wave 1 of Elliot. It is possible that this wave 1, it can reach the alvo of wave 3, which is at 50 (daily it is on wave 3)
A very high-octane altcoin, KUSAMA is a zero-layer blockchain that allows the creation of any blockchain with any type of consensus
We follow the supports and resistances no 6H:
Main support levels: 41.86 / 37.54
Main Stamina Levels: 46.44 / 49.81
MACD : Optimistic
RSI : Exhaustion of buying forces
EMAs: Optimistic


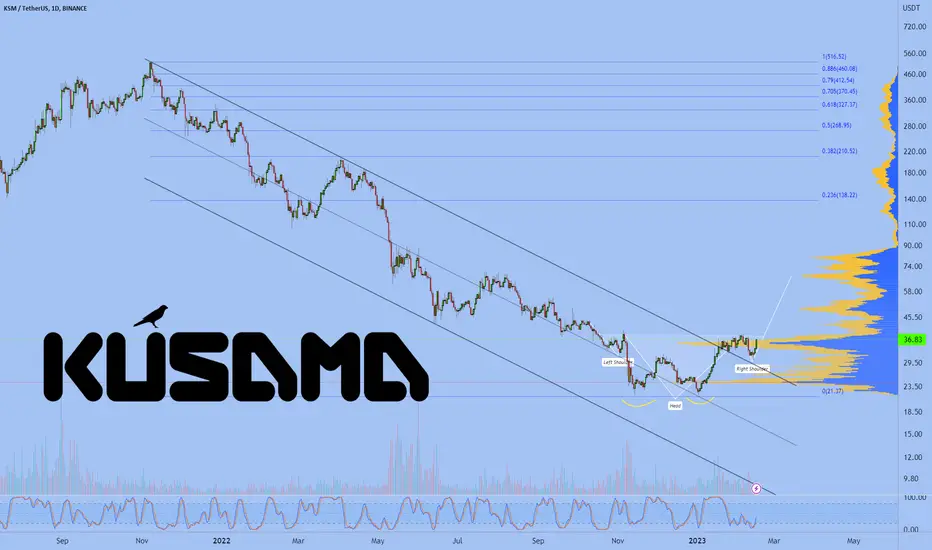
KusamaBreak out and tested resisitance line
Formed a double bottom, you can also see an inverted head and shoulders pattern
RSI oversold
Best regards EXCAVO
KSMUSDT posible target KSMUST could either continue its bullish rally or retraces a little bit and reverse aggressively.
KSM : INCREASE VIEWTrend study shows that KSM can become interesting in the coming time.
For this reason, we will follow the coin for the next 24H and If the trend looks promising, we will continue to track it for the coming time.

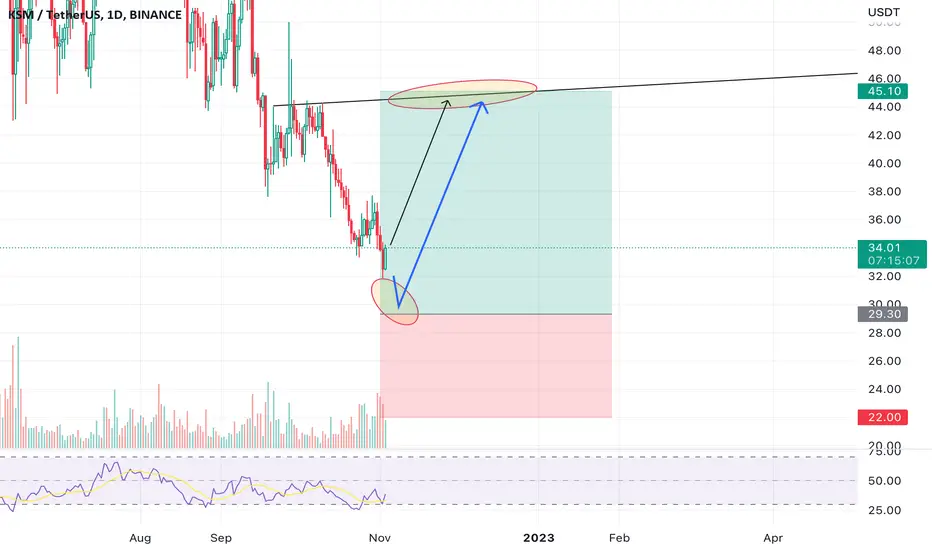
BULLISH ON KSMKSM looks extremely bullish atm. BTC looks uncertain and that’s what makes this trade slightly riskier however I believe if btc goes flat for some time we can see a strong move up!
1st TP $44
2nd/3rd TPs have been added to the chart but I will evaluate further after the first one.


KSMUSDT | APPROACHED TO SUPPORTKSMUSDT is at horizontal support where bulls once again can show some momentum, while having a double bottom too. The falling trend line is a hurdle for bullish trend continuation. There is a bullish divergence on RSI too.
The break above falling trend-line will give complete control to bulls. While break below double bottom will give strength to bears.
Trade your levels accordingly.

KUSAMA - Nice retest of long term trendlineAfter the retest expect a bounce toward 37 and then 43 if it has the steam.

Testing the KSM 23,50 supportKusama is deemed the canary network of Polkadot, with loads of experienced Devs building parachains and testing things out.
KSM doesn't seem to want to break the 200 MA just yet. I'm looking for a confirmation of the 23,50 support before going long.

KSM USDT TODAYApply your own risk management.
hunt the profits at any level you see convenient for you.
Green Zone for entry,
Red Level Exit,
Yellow levels are targets.
have a good day guys.

KSM - Rising wedge about to breakKSM's upward trend in 5 blue waves appears to be reaching its conclusion, with a possible break below the lower channel of the wedge expected shortly.
A target of $30 is likely, based on the wedge base, a 50% pullback, and previous wave 4 support.

KSM/USDT. 💰 #KSM/USDT Daily Timeframe
🐃Bullish structure on Kusama:
- Breakout of the Double Bottom on Daily
- Bullish Flag below the resistance confluence of 37.70 Supply Zone + Descending Resistance
One thing we need to do now is to break through the mentioned resistance conflunce☝️ Full Send if we do so ✈️
BitVero Crypto Academy.
Disclamer:
We are not financial advisors. The content that we share on this website are for educational purposes and are our own personal opinions.

I know 0 about KSM, but check this out:If we are bullish, wouldn't you want to see price drop a little? We see price dropping for institutions to buy at a discount, while everyone buys the top and FOMO. This is not financial advice.

KSM Buy the breakoutHello Traders!
Welcome back to another trade with Analyst Aadil1000x.
Today we are preparing to buy the KSM after a breakout. We are aiming minimum of 3.2% move. We are setting a buy limit at the reversal point.
KSM Buy Limit @ 34.90
Stoploss 34.22(-1.95%)
Target 1, 36.02(+3.18%)
Final Target 37.92(+8.65%)
Don't forget to hit the like button and follow to stay connected.


Go go//@version=4
study(title="OBV Divergence Indicator")
pivot_right = 5
pivot_left = 5
max_range=50
min_range=5
obv_value=obv
plot(obv_value, title="OBV", linewidth=2, color=color.black)
//check if we have pivot low in obv
pivot_low_true = na(pivotlow(obv_value, pivot_left, pivot_right)) ? false : true //returns price of the pivot low point. It returns 'NaN', if there was no pivot low point.
//Create a function that returns true/false
confirm_range(x) =>
bars = barssince(x == true) //Counts the number of bars since the last time the condition was true
min_range <= bars and bars <= max_range // makes ure bars is less than 60 and less than 5 and returns true
//------------------------------------------------------------------------------
// obv higher low check
OBV_HL_check = obv_value > valuewhen(pivot_low_true, obv_value , 1) and confirm_range(pivot_low_true )
// Price Lower Low check
price_ll_check = low < valuewhen(pivot_low_true, low , 1)
bullCond = price_ll_check and OBV_HL_check and pivot_low_true
//Plot the areas, terneary conditional operator
plot(
pivot_low_true ? obv_value : na,
offset=-pivot_right,
linewidth=3,
color=(bullCond ? color.green : color.new(color.white, 100)))//colornew applies the specified transparency to the given color
)
plotshape(
bullCond ? obv_value : na,
offset=-pivot_right,
text=" BUY ",
style=shape.labelup,
location=location.absolute,
color=color.green,
textcolor=color.white
)

2//@version=4
study(title="OBV Divergence Indicator")
pivot_right = 5
pivot_left = 5
max_range=50
min_range=5
obv_value=obv
plot(obv_value, title="OBV", linewidth=2, color=color.black)
//check if we have pivot low in obv
pivot_low_true = na(pivotlow(obv_value, pivot_left, pivot_right)) ? false : true //returns price of the pivot low point. It returns 'NaN', if there was no pivot low point.
//Create a function that returns true/false
confirm_range(x) =>
bars = barssince(x == true) //Counts the number of bars since the last time the condition was true
min_range <= bars and bars <= max_range // makes ure bars is less than 60 and less than 5 and returns true
//------------------------------------------------------------------------------
// obv higher low check
OBV_HL_check = obv_value > valuewhen(pivot_low_true, obv_value , 1) and confirm_range(pivot_low_true )
// Price Lower Low check
price_ll_check = low < valuewhen(pivot_low_true, low , 1)
bullCond = price_ll_check and OBV_HL_check and pivot_low_true
//Plot the areas, terneary conditional operator
plot(
pivot_low_true ? obv_value : na,
offset=-pivot_right,
linewidth=3,
color=(bullCond ? color.green : color.new(color.white, 100)))//colornew applies the specified transparency to the given color
)
plotshape(
bullCond ? obv_value : na,
offset=-pivot_right,
text=" BUY ",
style=shape.labelup,
location=location.absolute,
color=color.green,
textcolor=color.white
)

KSM descending channel breakoutKSM / USDT
Kusama “the little sister of DOT”
broke out the long term descending channel
Looks bullish in HTF

KSM | BITCOIN | DECRYPTERS | DOT FAMILYHI people welcome to team Decrypters
Daily to Weekly Double bottom Retest and continuation

Can go to 38$ if the bitcoin keeps on going upHere is some key levels identified on higher timeframes.

