KSM/USDTKSM/USDT
Formed a descending angle pattern.
The upward divergence is quite evident.
It is on a support zone.
In my opinion, it can grow up to the area of 46 dollars.
#KSMUSDT #KSM #BTCUSDT #BTC #ETHUSDT #DOGE #DOGEUSDT
KSMUSDT trade ideas

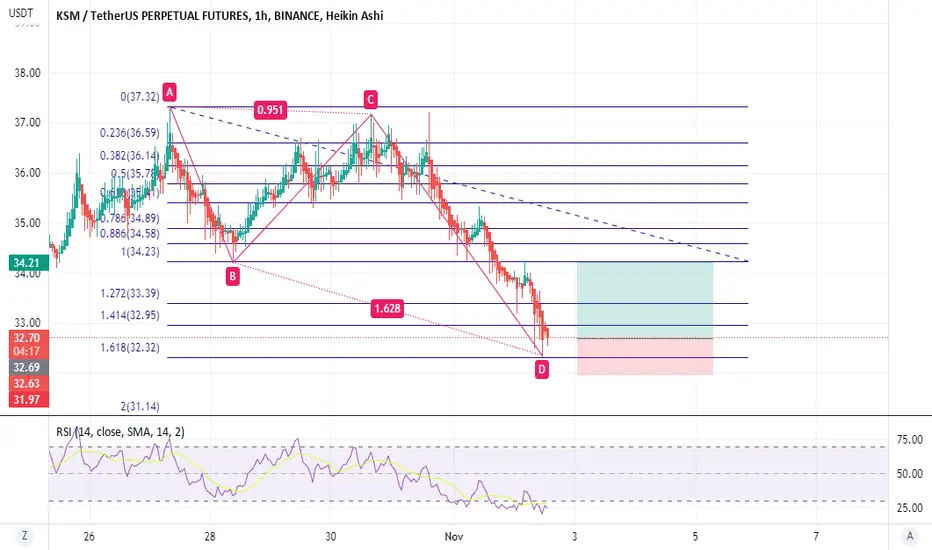
SIMPLE BUY IDEA KMSUSDTWe have an abcd pattern that went to 1.618 + oversold on the RSI it can be a good oppurtunity to buy and aime for the fibonnaci's lvl 1 or we can for an confirmation with a candlestick pattern and take it later on
KSMUSDT | BULLS ZONEKSMUSDT has been in downtrend and recently broken above the falling resistance.
The price is currently trading above the resistance.
The bulls are in control.
Manage your trades accordingly.

Trade 18 #KSM
⚝Skialogic⚝
$KSM
Exchanges: Binance Futures
Directions : Short
ENTRY:
35.74
TAKE PROFIT Targets:
34.62
Stop-Loss:
36. 21
If you have any questions please send me message or via comment.

KSM - breakoutKSM is approaching the descending trendline on the 4H timeframe. If the trendline is broken we might expect some bullish movements upward.
Opening a LONG position at these prices.

KSM | This Will Be A Runner | CryptoWhat Is Kusama (KSM)?
Self-described as "Polkadot's wild cousin," Kusama is an experimental blockchain platform that is designed to provide a massively interoperable and scalable framework for developers.
Kusama is built on Substrate — a blockchain building kit developed by Parity Technologies. Kusama has almost the same codebase as Polkadot — one of the most successful interoperable blockchains.
By deploying on Kusama, fast-paced projects gain access to a highly scalable, interoperable sharded network, with features that are not yet available on Polkadot. To that end, Kusama describes itself as a “canary network.”
The platform is designed to provide a testbed for developers looking to innovate and deploy their own blockchain and can be used as a preparatory network before launching on Polkadot — though many projects opt to stick with Kusama for their final product.
Kusama benefits from a low barrier to entry for deploying parachains, low bond requirements for validators, and is most commonly used by early-stage startups and for experimentation.

KSMUSDTHello Crypto Lovers,
Mars Signals team wishes you high profits.
This is a one-day-time frame analysis for KSMUSDT
In this chart, we have R2 and R1 as the resistance areas which both represent the unsuccessful triumphs of the price to rise. And S1 and S2 are our support areas at the bottom in which the support of price at several points is obvious. Hence, we have the price fluctuating over S1 and we believe it will start a rising trend after a little fall and by giving us some confirmation candles to rise, our long position is activated and then the price will rise toward R1 or some higher amounts. It seems that the possibility of a fall below S1 is so low for the price at the moment.
Warning: This is just a suggestion and we do not guarantee profits. We advise you to analyze the chart before opening any positions.
Wish you luck

KSMUSDT | SUPPORT ZONEKSMUSDT has once again approached to horizontal support level where bulls once again can show some momentum.
The bullish divergence on shorter time has started to appear on the RSI . We need bullish candle on the support to go for long.
Trade your levels accordingly.

KSM looking bullishWhen observing the Weekly and Daily we see that the RSI has reached oversold regions and is diverging showing possible strength coming in soon.
I am waiting for one more low to form around $37 to complete my wave count before a long position.
Everyone still bearish but the charts are showing a strong market for the rest of the year.
Trade safe
God Bless

KSM 1D - Possible upward movementLooking at the daily, you can see the formation of an accumulation triangle with a higher probability of a rise, which can raise KSM to values, at first, around $48.62.
Which would be awesome and there's also a magnetic force from the ichimoku cloud which makes KSM make an upward move.
From the top (05/17/2021) to today, it corrected about 93.46% which gives us the clarity of the upward movement, as Kusama is of very high octane and deep principles. If it breaks $44.86 the bullish move is imminent. Let's not forget about the latent oversold shown on the RSI. Anyway all technical indicators show an upward movement. Follow support and resistance in 1H time frame
S: 39.57 / 39.08
A: 43.23 / 40.58 / 41.59 / 42.40

ksm long trade setupKSM is moving in a symmetrical triangle and trying to break out. The point of control is also acting as strong support inside the triangle.

KSMUSDT 1HKSM 1H Supports and Resistances:
S- $42.25
S- $42.46
S- $42.06
=====================
R- $43.23
R-$43.48
R- $43.03

KSM/USDT Long ideaShort term KSM / USDT pair long idea
* EQL’s created (liquidity below
* FVG Below
* Leg up that created FVG swept liquidity
➡️ Expecting price to sharply deep dive into FVG and reclaim trendline before moving up

KSMUSDT | TRADE IN RANGEKSMUSDT has been trading in the range.
The price has made multiple attempts to break above but get rejected.
Currently, the price is approaching to the lower side of range.
The bulls will show strong momentum at support zone.
Trade your levels accordingly.

$KSM - getting ready to FLYHello my Fellow TraderZ,
Lets catch the #KUSAMA $KSM before it fly.
$KSM is ranging inside the SYMMETRICAL TRIANGLE Pattern and trying to break it.
Buy only after the candle closing above $44.
Orange lines are TP Points.
CHEERS!!!

KSM - AnalysisLast week, KSM registered a range trend between two support and resistance ranges. The resistance is in the range of $43.8 to $44.8, and the support which is in the range of $37.8 to $40.3, has so far prevented the currency from continuing to move in both directions. A downtrend line is also considered as resistance on the chart and reinforces the static resistance range so buyers need to break through the dynamic resistance to reverse the price. In this case, the first target that can be considered for this currency is in the range of $57, which resistance can make the price enter a corrective wave in smaller time frames. In the four-hour time frame, an uptrend line can be used as support. If this support range is broken, the price can again move towards the main support.

KSM / USDT FUTURES Quick tradeQuick position for short
This is not financial advice.
Trade at your own risk.

KSMUSDT 1DOn the 1D chart, it has formed a downtrend line, which it is currently trying to overcome, its RSI shows a cooling off from buyers, making such a breakout difficult.
In the Keltner Channel indicator, KSM is positioned at the channel's median, if it looks for the upper line that coincides with the Ichimoku cloud, we can witness the breakout of the downtrend line.

ksmusdt sellarea of confluence around the 61.8 fib level, reacting around the support level at the 15 min time frame, bearish enviorment,

#KSM is following a pattern. According to the pattern BIG dump iFocus on chart. I think it will dump and then test the trendline Support. Then we may a huge pump.

KSMUSDT Analysis (H&S)Hello friends.
Please support my work by clicking the LIKE button👍(If you liked). Also i will appreciate for ur activity. Thank you!
Everything on the chart.
Entry: market and higher
Target zone: 34-28
after first target reached move ur stop to breakeven
Stop: ~60 (depending of ur risk). ALWAYS follow ur RM .
Risk/Reward: 1 to
risk is justified
Good luck everyone!
Follow me on TRADINGView, if you don't want to miss my next analysis or signals.
It's not financial advice.
Dont Forget, always make your own research before to trade my ideas!
Open to any questions and suggestions.

KSM. $66 in June '23 or $19 in Dec '22?The situation is ambiguous. It is likely that the bottom of the market is forming at the moment. Those who are waiting for a fall may not see it. On the other hand, it seems that there has not yet been a complete capitulation... But! Ask yourself, is it possible to draw a parallel with 2019 and earlier? It's definitely hard to say. At the moment, ecosystems are completely different... They are more solid, with a huge number of devs, investments and the desire to create necessary, useful products. And of course, do not forget about the stats from 2018: 90% of the total supply of bitcoin is held by 1%
Have a good day!

KSMUSDT | UPSIDE POTENTIALKSMUSDT has broken above the falling trendline.
The price is been trading with in a rectangle. The price is currently trading at upper side of triangle.
The break above will favor bulls.
Trade your levels accordingly.
