Can KSM get above $1000?$1000 is a little more than 2x from here. If DOT can do a 3-4x. KSM should be able to do a 4-5x. So $1600-2000. Top.
Let's see!
KSMUSDT trade ideas

💡Don't miss the great buy opportunity in KSMUSD @kusamanetworkTrading suggestion:
". There is a possibility of temporary retracement to the suggested support line (385.1).
. if so, traders can set orders based on Price Action and expect to reach short-term targets."
Technical analysis:
. KSMUSD is in a range bound, and the beginning of an uptrend is expected.
. The price is above the 21-Day WEMA, which acts as a dynamic support.
. The RSI is at 56.
Take Profits:
TP1= @ 406.6
TP2= @ 417.1
TP3= @ 425.2
TP4= @ 443.0
TP5= @ 455.6
SL= Break below S2
❤️ If you find this helpful and want more FREE forecasts in TradingView
. . . . . Please show your support back,
. . . . . . . . Hit the 👍 LIKE button,
. . . . . . . . . . Drop some feedback below in the comment!
❤️ Your support is very much 🙏 appreciated!❤️
💎 Want us to help you become a better Forex / Crypto trader?
Now, It's your turn!
Be sure to leave a comment; let us know how you see this opportunity and forecast.
Trade well, ❤️
ForecastCity English Support Team ❤️

💡Don't miss the great buy opportunity in KSMUSD @kusamanetworkTrading suggestion:
". There is a possibility of temporary retracement to the suggested support line (385.1).
. if so, traders can set orders based on Price Action and expect to reach short-term targets."
Technical analysis:
. KSMUSD is in a range bound, and the beginning of an uptrend is expected.
. The price is above the 21-Day WEMA, which acts as a dynamic support.
. The RSI is at 56.
Take Profits:
TP1= @ 406.6
TP2= @ 417.1
TP3= @ 425.2
TP4= @ 443.0
TP5= @ 455.6
SL= Break below S2
❤️ If you find this helpful and want more FREE forecasts in TradingView
. . . . . Please show your support back,
. . . . . . . . Hit the 👍 LIKE button,
. . . . . . . . . . Drop some feedback below in the comment!
❤️ Your support is very much 🙏 appreciated! ❤️
💎 Want us to help you become a better Forex / Crypto trader ?
Now, It's your turn !
Be sure to leave a comment; let us know how you see this opportunity and forecast.
Trade well, ❤️
ForecastCity English Support Team ❤️

KUSAMA to $3300 with flag patternresistances in the way of $3300:
R1=$354
R2=$454
R3=$527
R4=$758
R5=$1150
R6=$1566
R7=$2764

KSM/USD - Kusama on the brink of a breakout!Kusama has pumped all the way to resistance. A break above and the damn will burst.
Next target will be the ATH at $600.
Kusama has been a performer in 2021, one last pump before the end of the year?
Like and follow if you liked this idea!

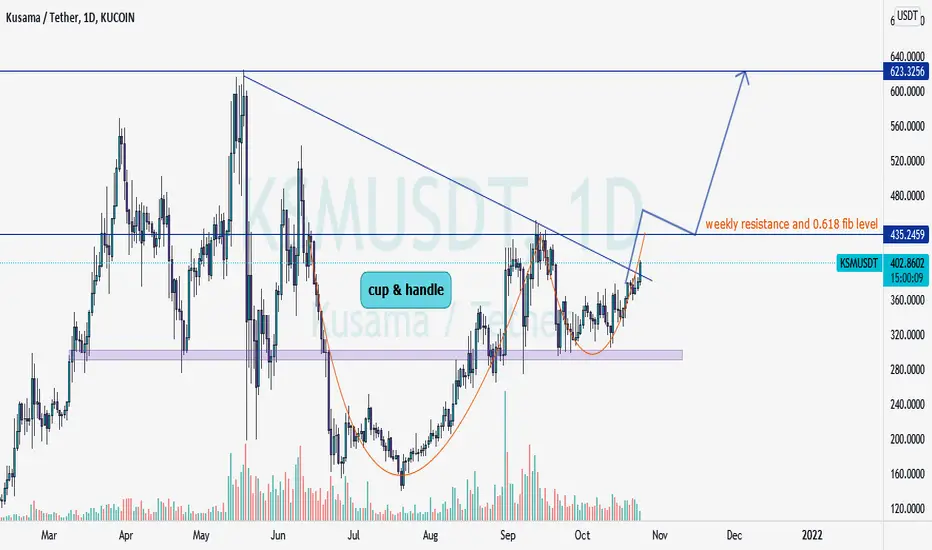
KSM_USDTKSM is forming cup and handle , this platform is the high potential project in crypto , if break resistance line in weekly , is so bullish in short and mid term , this coin is waking up and huge pump is coming , enjoy from this call .
KSMIt has a chart similar to the Bitcoin chart when it was priced at $ 40,000
There is a lot of room for growth if you cross the trend line
Shopping in steps is the best way
For the next two months, any negative amount on this chart is just a good buy position

KUSAMA READY FOR TAKEOFFWhats up my crypto junkies!
After following Polkadot for some time now (love the project).... Kumsama is the sleeping giant following in every foot step. You will see the purple channel I created to give us our first target of where this is going next. The next 2 targets are just simply the following resistance levels. Given that DOT was able to break threw them and there is plenty correlation between the two, I believe Kusama will follow. Target 4 is the height of the cup pattern measured from the breakout. If you missed out on the DOT pump... don't miss this one.
Good luck!

#KSMUSDT Daily Chart
Price was consolidating between the support at $310 and the resistance at $370. Both sides were tested multiple times which now makes them weak and should not hold long. Although MACD is showing mixed, RSI is slightly above 50% and price is just above EMA ribbon. I expect a breakout from the resistance area to occur reaching the daily supply which should not hold as it has been tested and price should be able to reach the second major supply at $562, possibly hitting a new ATH.

KSM Idea for Q4 2021 Posting my idea for Kusama for the rest of the year.
Considering the amount of hype around the DOT ecosystem, I am expecting this to move a lot faster than the magic squiggly line I drew. Parachain auctions are ongoing and expect them to boom once DOT launches their mainnet. This is of course, contingent on DOT launching successfully and projects trying to get a parachain slot. It's hard to imagine DOT botching their launch with how professionally and detailed they've ran the entire project.
Idea for DOT:

Kusama (KSM) Will Be Heating Up $400 IncomingKusama has been slowly marinating about to cook up. With Polkadot (DOT) trending towards all time highs Kusama will most likely follow in the weeks to come. Kusama has been moving sideways squeezing between $315 - $350 since September 21st and now fighting to bust pass the $370 resistance area . A run up back to the $400 point of control (POC) area will be more probable once a full break past resistance happens. Still a good amount of run up on the RSI as well. We've been on a nice steady uptrend since July 21st. Kusama has a good chance of re-testing its all time highs as well.
Keep Kusama on your radars! There's still a nice amount of room for growth with only a $3 billion market cap compared to Polkadot's $43.3 billion. Only a max supply of 10,000,000 coins!
Support: $315
Resistance: $370
Much peace, love, health, and wealth!

KSM to 3k by January 2022The curves are illustrating accumulation phases.
We seem to be approaching the end of the second one.
Fractal from the last bull-run indicates potential price action, while Fibonacci levels give you an idea for targets.
Enjoy and trade,
Goraxes

KSM long setupWe have some daily levels to break here. If we break them, the price will give good profits. But if BTC goes down everything will dump too. Be careful and DYOR!


KSM Ranging - Little further downward to go.Long at 245 - 270 range...
Matches with .382 Fib
Green EMA Line would line up
Would like to see some RSI and price divergence to give me another sign of confidence.
Would enter long through out 245-270 with my eyes on the .702 and .786 to begin to take some profits.... at the very least take out the cost I put into it.
While BTC has been going up a few names like KSM and COMP have been going down, giving me the feeling that it will be one of the first ones to rebound and go up after BTC has a downward correction and sits sideways..

KSMUSDT - BREAKOUT COMING.KSMUSDT has found support at the 0.50 fibonacci and started to show signs of a continuation, we can clearly see on the daily timeframe price is starting to make a series of higher lows in this consolidation phase, waiting to see a daily close above the confluence of resistance for a entry confirmation.


KSMUSDT Technical Analysis
⏳ Spot
💎 KSMUSDT has formed a symmetrical triangle . The price is getting rejections at the minor support, so it is very likely that the price goes up to the major resistance which is the upper band of the triangle. if it breaks above it it will go to TP2
🌐 Tradingview
🏁 Short & Medium Term
💵 Invest Only 5% of your Portfolio
🎳 Entry at Market or at 340.0
☕️ TP1 410.0
🍺 TP2 515.0
🍻 TP3 _____
🍾 TP4 _____
🍷 TP5 _____
🍸 TP6 _____
🍹 TP7 _____
🎁 TP8 _____
🚫 SL 293.0
Good Luck 🎲
Check the Links in Description and If you LIKE this analysis, Please support our page and Ideas by hitting the LIKE 👍 button. ❤️ Your Support is really appreciated! ❤️
Traders, if you have your own opinion about it, please write your own in the comment box. We will be glad for this.
Feel free to request any pair/instrument analysis or ask any questions in the comment section below.
We will have more FREE forecasts in TradingView soon
Have a Profitable Day

KSMUSDTsee and watch :)
As you can see, the price above the red support range has maintained itself very well and it seems that it will soon move towards the specified range ...

KSM/USDT BUY SIGNALI love these perfect risk/reward opportunities like it is offered right now on the KSM. Perhaps most cryptos will start a strong uptrend from this point onwards... but lets see.

KSMUSDT Daily TimeframeSNIPER STRATEGY (new version)
It works ALMOST ON ANY CHART.
It produces Weak, Medium and Strong signals based on consisting elements.
NOT ALL TARGETS CAN BE ACHIEVED, let's make that clear.
TARGETS OR ENTRY PRICES ARE STRONG SUPPORT AND RESISTANCE LEVELS SO THEY CAN ACT LIKE PIVOT POINTS AND REVERSE THE WAVE (or act like a mirror that can reflects light) BASED ON STRENGTH OF THAT LEVEL.
ENTRY PRICE BLACK COLOR
MOST PROBABLE SCENARIOS TARGETS GREEN COLOR
LEAST PROBABLE SCENARIOS TARGETS RED COLOR
DO NOT USE THIS STROTEGY FOR LEVERAGED TRADING.
It will not give you the whole wave like any other strategy out there but it will give you a huge part of the wave.
The BEST TIMEFRAMES for this strategy are Daily, Weekly and Monthly however it can work on any timeframe.
Consider those points and you will have a huge advantage in the market.
There is a lot more about this strategy.
It can predict possible target and also give you almost exact buy or sell time on the spot.
I am developing it even more so stay tuned and start to follow me for more signals and forecasts.
START BELIEVING AND GOOD LUCK
HADIMOZAYAN


Possible Buy for KSMHi,
Here is a possible trade for a long on KSM, I think the price will go down a little bit lower, and bounce to touch the resistance.
Let's see if it will touch my green gox buy zone ? or if it will go down at the support at around 298$
Regards
