$KSM/USDT 90m (Binance Fut.) Symmetrical triangle near breakoutKusama is accumulating for a week and just regained 50MA, seems to be ready for a local up-trend.
Self-described as "Polkadot's wild cousin,"that blockchain platform is designed to provide a massively interoperable and scalable framework for developers.
Current Price= 332.11
Buy Entry = 332.39 - 326.51
Take Profit= 349.97 | 373.21 | 395.29
Stop Loss= 312.97
Risk/Reward= 1:1.25 | 1:2.66 | 1:4
Expected Profit= +18.69% | +39.84% | +59.94%
Possible Loss= -15.00%
Fib. Retracement= 0.382 | 0.618 | 0.883
Margin Leverage= 1x
Estimated Gain-time= 1 week
KSMUSDT trade ideas

URGENT KSM tradeQuick guys, I didn't have enough time to do the chart work, but this seems like in a perfect buy zone.
I will update a full fetched chart in the next one.

🆓Kusama (KSM) Oct-2 #KSM $KSMThe buying force of KSM is increasing and it is very strong at 340$ zone, so in next days, KSM could pump up to 420$ and 540$ easily. But if it loses this 340$ zone, it will fall down to 280$ zone
📈RED PLAN
♻️Condition : If 1-Day closes ABOVE 340$ zone
🔴Buy : 340$
🔴Sell : 420$ - 540$
📉BLUE PLAN
♻️Condition : If 1-Day closes BELOW 340$ zone
🔵Sell : 340$
🔵Buy : 280$
❓Details
🚫Stoploss for Long : 10%
🚫Stoploss for Short : 5%
📈Red Arrow : Main Direction as RED PLAN
📉Blue Arrow : Back-Up Direction as BLUE PLAN
🟩Green zone : Support zone as BUY section
🟥Red zone : Resistance zone as SELL section
🅰️A : The Close price of 1-day candlestick is Above the zone
🅱️B : The Close price of 1-day candlestick is Below the zone

ksmksm is making a bull flag and if candle close above the resitence .it can go for higher targets .looking good on higher time frames also .making a cup and handle on daily time frame .
NFA DYOR

$KSM (Kusama) offering a very attractive R/R ratio 🐮Loaded up on $KSM as I find this R/R ratio very nice.
Take notes 🧞♂️

KSMUSDT 4HRBullish Bat STRONG Zone at strong support
On Type 1 Entry Pattern given good reaction & Hit TARGETS
now price is again in PRZ Zone of Pattern it becomes a TYPE2 Entry which is REVERSAL
Price need to follow GREEN TREND LINE and hit Target 1 & 2 , else if Price BREAKS RED TREND LINE is EXIT
POTENTIAL BUY


KSM (LONG for Mid-Term)KSM reversed from support zone (50% Fibo.) for 5th times!! it seems that appropriate in this prices for the Mid/Long-Term (in case of the trend line would be broken)

very important leves for KSM, decision making levelI explained it in the chart
it is NOT A FINANCIAL ADVISE
better to wait and see the which way it directs

KSM USDT SHORT SWING TRADE | KSMUSDT | SHORT @ 352 - 348 | TP @ 344, 340, 336, 332, 328 | SL @ 368 | PATTERN = HIGH POLE WARNING |
PNF chart on the hourly shows a trend reversal, HIGH POLE WARNING.
The strategies I use involve a mix of PNF and Renko. My type of trading is strictly swing trading.

KSMUSDTThe yellow line has now become an important resistance for the price, if the price can break the yellow line, the next target will be ATH. If the price falls, the green lines are good support.
In the current situation, the price will be more likely to fall to the range of $ 313
........
No one but God knows the future, we only state the possibilities
_______
Good luck


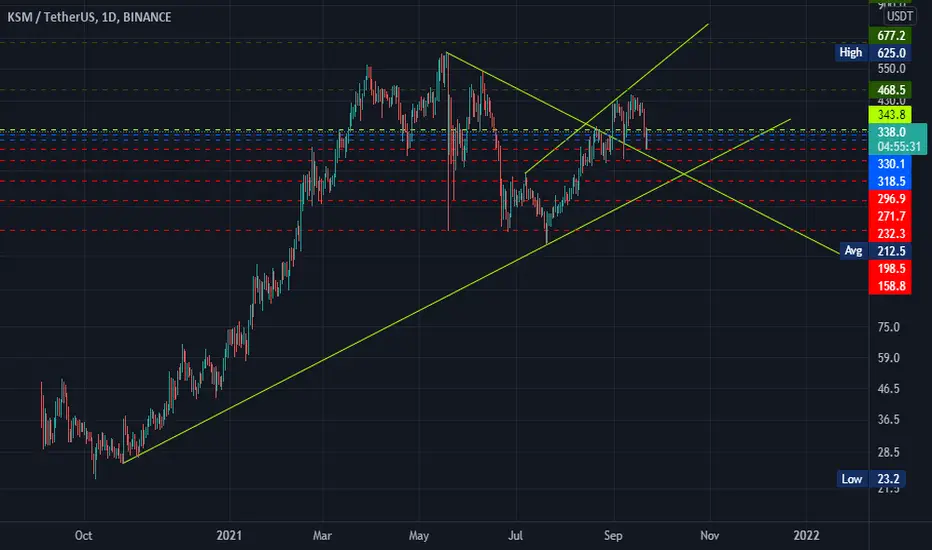
KSNUsdt Update for HODLERSWhat is Kusama?
Kusama is a scalable network of specialized blockchains built using Substrate and nearly the same codebase as Polkadot. The network is an experimental development environment for teams who want to move fast and innovate on Kusama, or prepare for deployment on Polkadot.
Kusama was founded in 2019 by Gavin Wood, founder of Polkadot and co-founder and former CTO of Ethereum.
this targets for HODLER
you trust Polkadot Blochchain so can trust Kusama
so safe and great project
kusama going up soon adn this targets for hodlers targets on bullish market this year
GL
EntryPoints:
330.1
318.5
Supports:
296.9
271.7
232.3
Resistance:
343.8
Targets: (Remember this targets for HODL but you for short time can set close targets)
468.5
677.2
979.0
1654.9
GL
Ksm usdtKsmusdt making bullish bat pattern
Stoploss mention
Take profit mention.
Financial advice
Thanks me latter
InshaAllah

ksmusdtksm has completed a bullish harmonic bat pattern and in the potential reversal zone.
NFA DYOR


Kusama / Solana FractalThe similarities between the two are incredible.
I hope you found the idea interesting;)

KSM ABOUT TO FALL THROUGH.This is just an idea.
I feel that we are going to get some downside with KSM very soon. We might have just dropped from a head, into a right shoulder now.
This is just an idea.

ksmusdtkusama is making a cup and handle pattern and if the pattern is completed and break out from neckline takes place .that green line could be the target for cup and handle pattern
NFA DYOR

Ksm should go up from here..Buy zone - 400usdt-420 usdt
Sell zone - 520usdt- 566usdt
Stop loss for this trade should be at 372 usdt.
With Link, Dot, Algo, Ksm is one of the coins that should see a major uptrend before resuming sell off
Good Luck!

KSMUSDT continue Upward TrendHello guys
i shown you everything in chart
i think there is no need explain about the chart and how to take position
but one thing is about fundamental of KUSAMA and DOT
These two can grow more more and more in future because of fundamental and i think after the auction of parachain
we can see the new ATH of both of them
The best zone for buying and take long position for futures is red zone that shown on chart
we need more knowlegde about what we are buying in crypto
Good Luck
Abtin

KSMUSDT🌟KSM is still undervalue in our believe and soon might earn the the respect it needs to be in this market with these upgrades
🌟anyway we put the entry point below the current value as a reason of the correction the chart needs to do now to complete its bullish cycle and goes for more
🌟we expect the average true range of the candles soon will be goes higher and in that case it matches our strategy and its calculated to no worries if we face some big collapses in the future
----------------------------------------------------------------------------------------------------------------
If you want to see more and more from these 💎 free signals:
🙏 Help us grow then
Each individual support counts 🙏
Tell us what do you like to know about the market and how do you see the forecasts
Share us your opinion
----------------------------------------------------------------------------------------------------------------
👉This idea has the confirmation of "advanced price action" 👍
👉Follow us and invite your friends too, this way we can share ideas and signal to anyone we care 👍
👉Hit share and spread the information in public chats or your twitter for everybody to get profit 👍
👉Tell us what's important for you in the market or what asset makes a difference in your investment basket 👍
📝Did you know money management and risk management are as important as your entry and exit point of a chart?
💰Plan a Trade before a Trade💰
💸Develop a strategy before you enter position
your strategy have to be a combination of money management + risk management + time management and profit management (the famous MRTP method made exclusively by our team💎)
Trade well ❤️
