KSM - Decision Time 🕒KSM has moved up 60% since our last post. Price bounced off perfectly from our area of interest. Ideally we would have wanted clear bullish moves but as it stands, it's still very corrective indicating that we may get another move down. If that happens, we will wait to see where price creates a floor and then find buying opportunities at a cheaper price.
KSMUSDT trade ideas

KSM - Decision Time 🕒KSM has moved up 60% since our last post. Price bounced off perfectly from our area of interest. Ideally we would have wanted clear bullish moves but as it stands, it's still very corrective indicating that we may get another move down. If that happens, we will wait to see where price creates a floor and then find buying opportunities at a cheaper price.


KSM over $600!KSM has been on a complete tear since last November when we entered the current upwards trending channel. Even through long periods of very high RSI the price continued to move up. However, KSM did not have a good April and slid back to the lower end of the channel.
The RSI bouncing (circled on the chart) as well as the MACD crossing the signal line tells us that a reversal to the upside is on its way. Additionally, we have now had two daily closes above the .236 level. As well as two daily closes above the 50 day moving average. All very bullish signs for $KSM.
I'm looking for KSM to get up to $600; the middle of the channel, and the .618 line. Secondary target would be around $800 is the RSI doesn't go too crazy or if BTC does has a dip that brings the whole market down.
Stop loss at a daily close under the lower end of the channel.
Have fun! Trade at your own risk

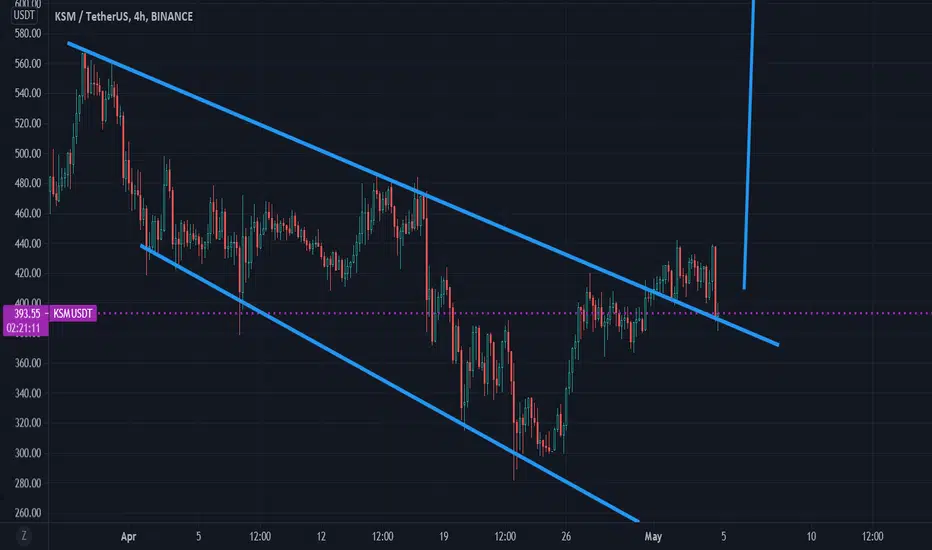
Possible TP's by breaking downtrendAs you can see, KSMUSDT has broken out the downtrend. Currently,
It tries to break out its previous peak which is a range between 405-412. If it stands on this area, the targets are shown.
Do not take any position without stop.
Glad to hear your comments, ideas and critics ^^

Kusama 5.7.21I know its hard for many of you to comprehend these things. Maybe your new. Maybe you never have seen a real bull market for alts. Let me tell you that if you think things are bubbly now, well youve really seen nothing just yet. If Kusama just continue to follow this trend yes we could see a 30,000 dollar Kusama. Now is this overshooting the target? Probably but hey i like to stir up some shit every now and then. KSM to the stars

Ready for BOOOOOOOOOOM BINANCE:KSMUSDT
keep eyes on this
ready for boooooooooom
take good profit and always be happy
i hope you enjoy

Kusama ready to flyKSM has been in a mega uptrend vs BTC for a long time, an especially vs USD. This year it made a new ATH vs BTC and currently it just retested some key levels both vs BTC and USD. It is now back above its 50 DMA and the monthly P looking very strong. Could easily hit R3 relatively soon. In my opinion Polkadot is also bullish which is definitely a plus! Maybe Polkadot and Kusama get listed on Coinbase together and we get a nice pump for both when that happens.


KSM: This Birdie Is Ready To Fly (E X P E C T C H A O S)The Bears reached the exhaustion point on the 25th of April, as indicated by the reversal on the MACD and the RSI moving out of the Oversold region.
Currently, on the daily chart, we can clearly make out a Symmetrical Triangle.
Trading on this formation is done by measuring the distance between the high and low, and placing it on the breakout/breakdown of the formation.
So, by finding the resistances and a Fib on the Triangle's H&L and another on the local trend, we can find some "realistic" price targets.
ENTRY: 434.93$ - 445.34$
TP1: 480.94$
TP2: 564.10$
TP3: 658.50$
TP4: 743.10$
SL: 388.40$
PLEASE NOTE : Wait for a daily close above the formation before entering.

KSM 5.6.21Kusama is such an undervalued gem. imo it is the true polkadot and many will come to understand this very soon. 5k ksm . think long term kids. the real crypto heads know a 10-12x is nothing in crypto when you think in months/years


Kusama 5.4.21You tell me. is that a bearish or bullish signal right there? omg it doesnt get any better than that right there. be aware these trend lines are never respected to the t. there will be some variance. also you need to think longer term. coming under it does not invalidate or give need for worry. its about how long does it close under it and i usually give it a week at least before i'll rethink the setup. for now 10000 percent bullish retest. if we get some serious volume, which i expect over the coming weeks, kusama will go straight up
KSMUSDT Ascending TriangleThe pattern appears to be an ascending triangle. we will wait to see a breakout after which the next resistance should be at 487.2


KSMUSDTHello to you all. Mars Signals team wishes you high profits at all times.
If we leave the triangle for the above purposes, we will start trading
Warning: This is just a suggestion to you and we do not guarantee profits.
Wish you luck!


KSM// UpdatePrice just finally broke out of the downtrend line and is retesting the broken daily zone.
Resistance turns support, holds and we're off. A break back within the TL will suggest more price depreciation so we have an opportunity for a tight stop.
Previous analysis linked.
