KSMUSDT trade ideas

🔥 KSM Massive Channel ContinuationKSM has been flying under my radar for a while, but since the price is moving quickly towards the channel support, I'm seeing great potential arise for a trade.
As seen on the chart, KSM has been trading inside a bullish channel for more than 4 months now, seeing more than 500% returns in that process. With Bitcoin's most recent sell-off, it's potentially time for a new bullish push towards the upper resistance of the channel.
Happy trading!


KUSAMA 30%+ Breakout Target Hi guys,
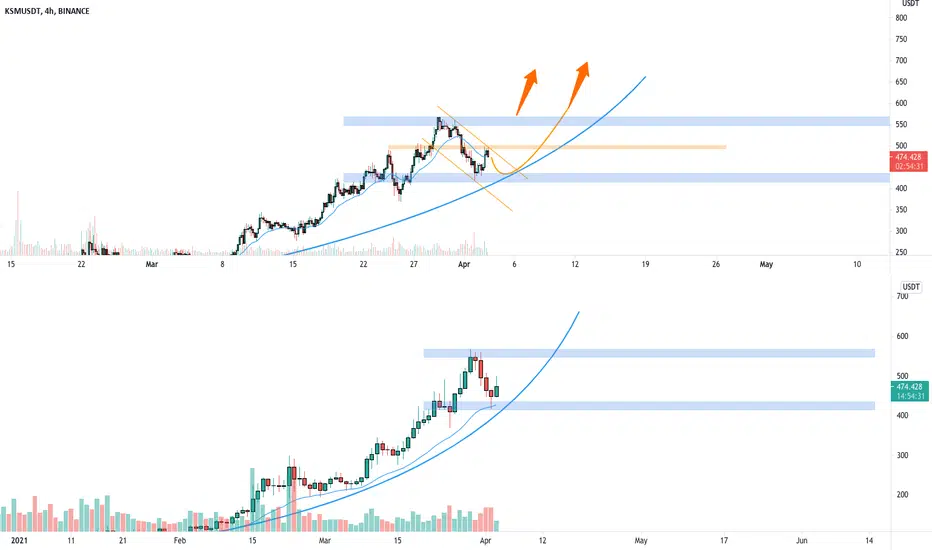
I will be short since Kusama is one fast bad boy.
If we close above the Orange MA, we can expect a continued 30% rise from 460 to 560 usd.
This depends as well of how BTC will play the markets, if it goes up, Kusama and the rest follows, if it dumps, we know a few will do their own thing.
So wait for a breakout confirmation above 460usd. if we get down in to the pattern expect a test of the support line down at 380usd.
TP:560usd
SL: define your own risk
Entry level: 465-440usd.
Not financial advice.
DYOR
Cheers!

KSMUSDTJust spelucation on the same setup as before (violet).
Two pin bars on the 77 and move up.
1.TP - lvr. 10x - high risk (lower entry only)
Or spot trade. Use it like me - after hit the first TP set your SL on the entry. ... after 2nd TP set your SL on the 1.TP.
Never loose your money...
LbL_CZ


KUSAMA (KSM) - Too many Support tests and Breakdown420-430 is a good support but Coins is testing it too many times with lower high formations.
I am expecting it too break and go towards our target of 370-380

KSMKSM looks ready to have another pop.
RSI going up and up everytime it touches the horitzontal support area.
Also great Fundementals for KSM in April would expect this to fly.


KSM - Parachain auctions driving reductionKusama is continuing to test support of the descending triangle pattern formed since March 29th.
If price continues to close below the 20MA, support could next be found at the dotted green line, approx $387.
However, the triangle indicates that a break of the green base support line could see a price target that exactly meets the 50MA at approx $330.
Considering the overall strong uptrend, a target of approx $330 might seem excessively bearish. Consider though that Kusama parachain auctions are likely beginning this month, and could be driving a lot of selling pressure to get price down for accumulation prior to the auctions beginning. The break in the original uptrend coincides with the announcement of the parachain auctions adding weight to this possibility.

Kusama (KSM): Running out of time (to accumulate)Please see the graph, I believe it is fairly self-explanatory. Sharp price movement upwards expected after MACD crossover to the upside again + RSI sub-45. Not much time before it pumps again, accumulation ending soon.
NOT FINANCIAL ADVICE.


KSMUSDT is creating a parabolic 🦐KSMUSDT is creating a parabolic, and on 4h timeframe the price is creating a descending channel IF the price will have a breakout from daily resistance, According to Plancton's strategy (check our Academy), we can set a nice order
–––––
Follow the Shrimp 🦐
Keep in mind.
🟣 Purple structure -> Monthly structure.
🔴 Red structure -> Weekly structure.
🔵 Blue structure -> Daily structure.
🟡 Yellow structure -> 4h structure.
⚫️ Black structure -> <4h structure.
Here is the Plancton0618 technical analysis, please comment below if you have any question.
The ENTRY in the market will be taken only if the condition of the Plancton0618 strategy will trigger.
KSMUSDT Analysis for upcoming weekAs per my analysis, KSMUSDT took the support of trend and consolidated enough to retain its previous position above the resistance.
RSI is indicating clear upward trend on 1H chart. Market sentiments are also in favor as in previous days buys tried to maintain their position above the support.
If we talk about entry level then it falls between 430-450, later on if it breaks the resistance of 490+ then its going to touch the level of 600. Put your stop loss below 400 and move to breakeven when it crosses the first resistance level. Do not use too much leverage.
Support my analysis if you think its appropriate and share yours.
Trade on your own risk and Best of luck from my side.

KSMUSDT LONGBULLISH DIVERGENCE
PRICE TESTED 1.618
BTC.D DOWN
BTCUSDT IN INVESRES HEAD AND SHOULDERS
HIGH RISK TRADE

KSMUSDTHello to you all. Mars Signals team wishes you high profits at all times.
The price has experienced a good uptrend and is now stuck in a triangle. We intend that if it can break the triangle as in the previous analysis, then a pullback will start to rise, and if it breaks from the bottom, it is less likely to fall more. He can experiment and attack upwards several times but he has not been able to break the resistance
Warning: This is just a suggestion to you and we do not guarantee profits.
Wish you luck!


KSM LONG ENTRY - GO!Ksm long entry from its retracement of its big run. Will enter o the 50% level and await another dip into the 61.8 level. targeting -27% first. Will keep updated in the comments

KUSAMA (KSMUSDT) EXPECTED 70% NEXT WEEKHello everyone,
this is my first time to publish trading idea hopefully not the last. first let me briefly describe what you are seeing on the chart. In white you can see the price of KSMUSDT, while in black that's the set of technical indicators that I'm using. this set is composed of simple moving averages with the following period lengths (20,40,80,160,320,640,1280,2560,4999). the purpose of using this methodology is to analyze both the trend and volatility over the short-term, mid-term, and long-term. it is worth noting that this is a line chart with each data point equal (H+L)/2 OF 2H candle sticks. this chart covers the last 6 months.
Now, let's get to how I got this prediction. basically this setup has two modes; compressed which is the buy zone and, stretched which is the sell zone. the compressed mode is when the price and short-term moving averages get closer to the longer-term moving averages, while the stretched mode is when the price and short-term moving averages get further away from the longer-term moving averages. to trade this, the more compressed it is the more you buy and the more stretched it is the more you sell while in between you just freeze. Now if you look at the chart you will find KSMUSDT is in the compressed mode and you will see that it has very nice long-term trend, it doubles on average every 50 days (will explain how to quantify trend strength in next posts) which means that you are buying a very undervalued asset.
with all that said my conclusion is that KUSAMA (KSMUSDT) is expected to be one of the best performing crypto-assets in the next week or two.
please follow and get in touch if you have any questions. also If you like my idea and you have a job for me or you just want to tip me please find attached my KSM wallet address bellow:
FB1nskJ4bcR2aACtrmAEjMJUcbRhqTjNUWrvh2Qvm1dpCWV
thanks
