KSMUSDT Analysis: Potential Reversal or Further Decline?✨ Welcome to my channel. Here, we analyze a new crypto project or Forex pair every day.
📅 Let's dive into today's analysis, focusing on the KSMUSDT pair in the crypto market.
🗂 About the Project: Kusama (KSM) is an experimental blockchain platform designed to provide a proving ground for new technologies. It serves as a sister network to Polkadot, allowing developers to build and deploy decentralized applications (dApps) quickly and with lower risk.
📅 Weekly Timeframe Analysis
In this timeframe, KSMUSDT has experienced notable fluctuations. The price reached a significant peak before entering a correction phase. Currently, KSM is trading around the $21.18 level, with a key support at $17.38. A stabilization above $24.35 could signal a bullish trend, potentially targeting $37.42 and $55.99. However, a failure to hold above $17.38 might lead to further declines, with the next major support at $14.50.
📅 Daily Timeframe Analysis
On the daily chart, KSMUSDT has shown a bearish trend with the price consolidating around $20.44. The key resistance levels are at $24.23 and $27.00. A break above these levels could indicate a shift to a bullish trend. On the downside, a break below the $16.72 level might lead to further bearish movement. The RSI currently stands around 43.95, suggesting potential bearish momentum.
📅 4-Hour Timeframe Analysis
In the 4-hour timeframe, KSMUSDT is consolidating near the support at $20.05. A drop below this level could signal further declines towards $16.63. Conversely, a move above $21.20 could indicate a short-term bullish reversal, targeting resistance at $24.28. The RSI is around 47.61, indicating a neutral to bearish sentiment.
📊 RSI Oscillator
The RSI is currently ranging between 37.54 and 47.61 on different timeframes. Breaking these levels could provide confirmation for opening positions. However, always use these levels in conjunction with candle patterns and volume analysis to find the best entry and exit points.
📉 Given the current bearish signals in the daily and 4-hour timeframes, alongside the potential trend change in the weekly timeframe, I am inclined to open a short position. However, this is based on my trading strategy. Each trader should base their decisions on their strategies and risk management plans.
⚠️ Please note that this is not financial advice. I'm simply introducing this project to you, and remember always to do your own research.
🫶 If you found this analysis helpful and want to support me, please boost this analysis. Feel free to leave a comment or suggest a coin you'd like me to analyze next.
KSMUSDT trade ideas

KSMUSDT 1WKSM ~ 1W
#KSM Revisiting the Demand Zone. This Support Block is the best price to start accumulation again. with a short term target of at least 20%+


KSMUSDT Bouncing from Major SupportKSMUSDT Technical analysis update
KSM price has been ranging for the last 600 days, repeatedly touching and bouncing off its major support zone. Recently, the price has touched the support zone again and is now slowly bouncing from it. We can expect a bullish move from the current level.
Stop Loss : $18.00
Target: 100%-200%

KSMUSDT 1DA falling wedge formation has appeared on the #KSM daily chart. Buy it at the current price and at its support levels. In case of a breakout, the targets are:
$28.08
$34.36
$39.44
$44.52
$51.74
$60.95

KSMUSDT 1WKSM ~ 1W
#KSM Revisiting the Demand Zone. This Support Block is the best price to start accumulation again. with a short term target of at least 20%+

$KSMShort position with stop loss $24.5
Please DYOR before take s position
Always use stop loss and manage your own risk.

KSM bull flagKSM is coming off the bottom of a long and nicely forming weekly parabola. Another important indicator here is the weekly 50MA about to perform a golden cross up over the 200MA, highlighted in the pink circle.
KSM is a small cap, small circulation coin of a quality project associated with DOT. If, after Trump's amazing luck, he does in fact become the president again, the country may well crash into the mountain but not before there is a crypto bubble that makes 20-21 look like foothills.
Put simply, greed on the fear and greed index is going to need new maximums. Other news backing this thesis includes NVIDIA's Blackwell-Grace superchips entering production and AI quickly entering new territory.
With KSM currently approx. 20x below ATH, in this scenario it's possible we may see a 30-40x new high before 2026.
DISCLAIMER: Not financial nor investment advice and you trade at your own risk.

KSM bull flagKSM is coming off the bottom of a long and nicely forming weekly parabola. Another important indicator here is the weekly 50MA about to perform a golden cross up over the 200MA, highlighted in the pink circle.
KSM is a small cap, small circulation coin of a quality project associated with DOT. If, after Trump's amazing luck, he does in fact become the president again, the country may well crash into the mountain but not before there is a crypto bubble that makes 20-21 look like foothills.
Quite simply, greed on the fear and greed index is going to need new maximums. Other news backing this thesis includes NVIDIA's Blackwell-Grace superchips entering production and AI quickly entering new territory.
With KSM currently approx. 20x below ATH, in this scenario it's possible we may see a 30-40x new high before 2026.
DISCLAIMER: Not financial nor investment advice and you trade at your own risk.

KSM: Support BreakoutTrade setup : Price remains in a downtrend. Following a Bearish breakout from a Sideways Channel, it's also broken below $22 support level, making another Lower Low (also a sign of downtrend). It could revisit $16.70 next.
Pattern : Support Breakout . Once a price breaks below a support zone, it signals that supply from sellers has overwhelmed demand from buyers at this level and price is likely to decline further. Following a support breakout, the next closest support zone becomes a price target. Learn to trade key levels breakouts in Lesson 7.
Trend : Short-term trend is Strong Down, Medium-term trend is Strong Down and Long-term trend is Strong Down.
Momentum is Bearish (MACD Line crossed below MACD Signal Line) BELOW days ago. Price is neither overbought nor oversold currently, based on RSI-14 levels (RSI > 30 and RSI < 70).
Support and Resistance : Nearest Support Zone is $16.70. Nearest Resistance Zone is $27.00, then $33.00.

$KSM #Kusama Trading IdeaKSM/USD (Kusama) formed a potential falling wedge pattern by finding support at around $21-$24. Full send after a breakout. This is a daily timeframe. My next potential target would be around Golden Zone $43-$48.


#KSM/USDT#KSM
The price is moving within a descending channel pattern on the 4-hour frame, which is a retracement pattern
We have a bounce from a major support area in the color EUR at 23.00
We have a tendency to stabilize above the Moving Average 100
We have a downtrend on the RSI indicator that supports the rise and gives greater momentum and the price is based on it
Entry price is 22.00
First target 26.30
The second goal is 30.00
The third goal is 33.70

Long Idea on KSMok, I need to describe the damn thing, I came in, I just believe in the high season now (I will duplicate the description in coins that I will take)

KSMUSDT.1DIn this professional analysis of the Kusama (KSM)/USDT daily chart on Binance, I'll delve into the current technical setup and evaluate potential future movements based on the observed price action and indicators.
Price Action and Support/Resistance Levels
The current price of KSM stands at approximately $26.39, with a recent loss of 5.48% on the day. The chart identifies significant resistance levels at $34.72 (R1) and $47.90 (R2), as well as support levels at $23.37 (S1) and $15.29 (S2). These levels are crucial for understanding potential bounce-back points or further declines.
Technical Indicators
MACD (Moving Average Convergence Divergence): The MACD line is below the signal line and close to the zero line, indicating a lack of strong momentum and leaning towards bearish territory. The proximity to the zero line suggests a potentially weaker trend or a consolidation phase.
RSI (Relative Strength Index): The RSI is below 40, which typically indicates bearish momentum and shows that the asset might be approaching oversold conditions. This could potentially lead to a rebound if buyers step in near key support levels.
Market Sentiment
The overall market sentiment, as reflected by the technical indicators and recent price action, suggests bearishness in the short term. The significant drop in price, combined with the current positioning of the MACD and RSI, indicates that KSM may continue to face downward pressure.
Conclusion
Considering the bearish signals from both the MACD and the RSI, as well as the current price level nearing the first support at $23.37 (S1), KSM appears to be in a vulnerable state. If this support level holds, there could be a potential for a short-term recovery towards R1. However, a break below S1 could lead to further declines towards the more substantial support at S2. Given this outlook, traders should keep a close watch on these support levels and adjust their strategies accordingly, perhaps setting stop-losses to manage risk effectively in a volatile market. This analysis underscores the importance of vigilance in monitoring further developments and being prepared to act based on key technical levels and indicator signals.

Long signal for KSM/USDTThis technical analysis is based on the daily chart of KSM/USDT on the Binance exchange. This analysis draws two price channels and evaluates support and resistance levels.
Price Channel Analysis:
The previous bearish channel is broken out, and a bullish channel is formed.
The suggested entry point is around 28.93 USDT.
Entry and Exit Points:
Entry: 28.93 USDT
Take Profit: 38.28 USDT (32.28%)
Stop Loss: 26.70 USDT (7.72%)
R/R Ratio: 4.18
Conclusion:
This analysis suggests that by adhering to the specified take profit and stop loss levels, a successful trade can be achieved. The Reward/Risk Ratio for this trade is approximately 4.18, indicating a highly favorable risk-to-reward scenario. To manage risk effectively, it is recommended to strictly follow the stop loss level.

KSMUSD 1WKSM ~ 1W
#KSM Start making purchases gradually from here. this is an important support block that is very attractive to start accumulation again.

KSMUSDT-Falling Wedge Pattern#ksm/usdt
A falling wedge pattern has formed and If NYSE:KSM succeeds in breaking out from this pattern, a bullish rally towards $44 is expected📈

KSMUSDT 1D#KSM is moving inside a falling wedge pattern on the daily chart and it has broken the MA50. In case of a breakout, the targets are:
$38.40
$42.76
$47.11
$53.31
$61.21

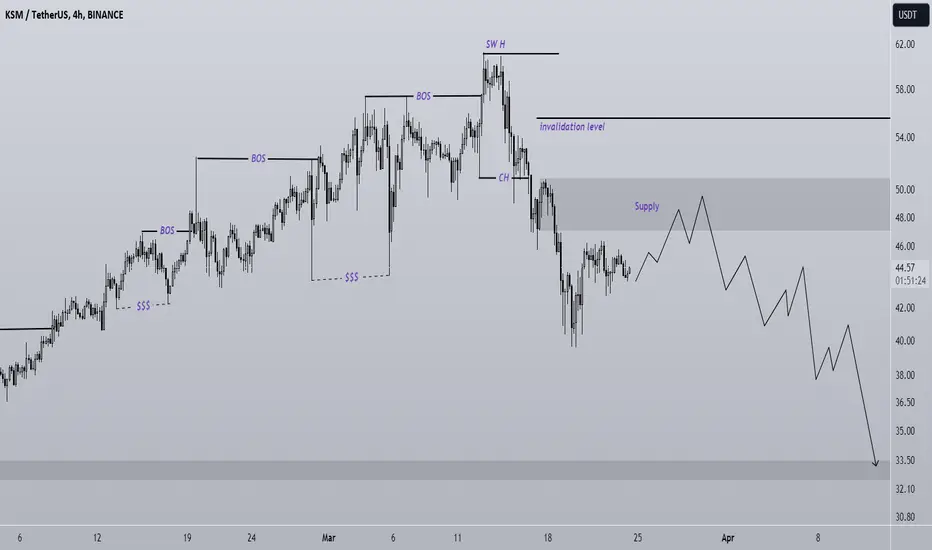
KSM short setupConsidering the bearish CH and the liquidity pools at the bottom of the chart, it seems that KSM intends to move towards the specified demand.
supply is a good place for sell/short positions
By maintaining the supply range, it can drop the demand side.
Closing a daily candle above the invalidation level will violate this analysis
Note that the financial market is risky, so:
Do not enter any position without confirmation and trigger.
Do not enter a position without setting a stop.
Do not enter a position without capital management.
When we reach the first TP, save some profit and try to move the stop continuously in the direction of your profit.
If you have any comments please post them, comments will help us improve our performance
Thanks
KSM: Approaching ResistanceTrade setup : Price remains in a downtrend. Following a bullish breakout from a Channel Down pattern, price reached $33 resistance for a +10% gain. If it breaks above that $33 level, it could revisit $38-40 next, for +20% potential upside. Overall, price remains in a downtrend until it breaks back above that 200-day MA (~$38).
Pattern : Price is Approaching Resistance, which is a level where it could pause or reverse its recent advance, at least temporarily. Resistance is often a level where price got rejected in the past, or potentially prior Support level that was broken. (concept known as polarity). Once price breaks above resistance, it can advance higher to the next resistance level. Learn to trade key levels in Lesson 7.
Trend : Short-term trend is Neutral, Medium-term trend is Neutral and Long-term trend is Strong Down.
Momentum is Bullish but inflecting. MACD Line is still above MACD Signal Line but momentum may have peaked since MACD Histogram bars are declining, which suggests that momentum could be nearing a downswing. Price is neither overbought nor oversold currently, based on RSI-14 levels (RSI > 30 and RSI < 70).
Support and Resistance : Nearest Support Zone is $27.00, then $22.00. Nearest Resistance Zone is $33.00, then $40.00.

KSM ???Hi.
BINANCE:KSMUSDT On Kusama we have a breakout from a descending triangle pattern and a retest is currently in process 👨💻
⚠️Anticipating profit gains of over 60% in the coming days.⚠️
Stay awesome my friends.
_ _ _ _ _ _ _ _ _ _ _ _ _ _ _ _ _ _ _ _ _ _ _ _ _ _ _ _ _ _ _ _ _
✅Thank you, and for more ideas, hit ❤️Like❤️ and 🌟Follow🌟!
⚠️Things can change...
The markets are always changing and even with all these signals, the market changes tend to be strong and fast!!

KUSAMA FROM ALL TIME HIGH - ALT SEASON - 2ND SCENARIOHere is what the second scenario look like for KUSAMA. Unlike the first this show that price has not finished the impulse wave going downwards and we might see price create another low around $13 and that is also a perfect point for either re-entry or DCA. from that point to the golden level 50% Fibonacci, there is over 550% gain. PREVIOUS ANALYSIS
