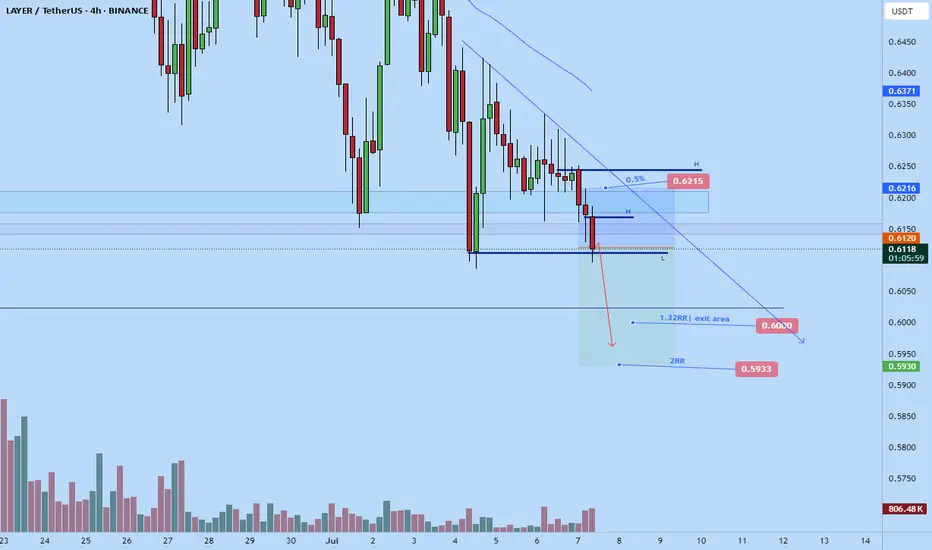
Layer scalp short to $.6Stop: $0.6215
Tp area: $0.6
Will monitor for potential 2RR exit at $0.5933
Trend is very bearish on Layer and with tariffs there's a good probability it will stick. Saw it a bit late though.
LAYERUSDT trade ideas
Sol layer short to $0.62Recently opened a short position on sol layer.
Aiming for $0.62 price target.
Roughly 2 RR.
STop: $0.64

Sol layer long to $0.6875Just now opened up a long position on sol layer. Targeting $0.6875
I anticipate that the market will try to make a new on the 1hr tf, which is around previous day wick high . Considering that we rejecting from support already I think its quite probable based on my DTT analysis.
Stop should be sufficient at $0.6535
market could push further but am just aiming to get in and out quickly. Let's see how it goes. Regardless how it goes, I think its a solid setup

Solayer, Big Rewards For The Patient, 630% Target ExposedYou could say that this is not an easy one because of Bitcoin's current situation. When Bitcoin is shaky, doubtful, the entire market becomes doubtful and hard to approach, but still, we buy the bottom/support and sell when prices are up.
Solayer produced an uncharacteristic rise previously, it can always repeat a strange behavior, it can detach from the market and move in its own way. There are always pairs that can do anything and do move strangely but also, market conditions can be something today and something different the next day. We shouldn't ignore a good opportunity based on assumptions or something that is not confirmed.
Solayer produced a double-bottom and the volume is good now with the current bounce.
There is also an ending diagonal (blue), which is a reversal pattern.
Say the short-term goes awry and Solayer continues lower, it hits a lower low; how long is it going to take for a reversal to happen? Once we hit bottom, if the bottom is not hit it isn't likely to be far away.
Say things go very bad and we get another low; how long will it take, two months?
That's the beauty of Cryptocurrency trading. Say it does go bad and instead of a reversal we get lower and it takes two months for prices to go up. Guess what? Profits potential would still go beyond 200% within 3 months. That's pretty good for sure no matter how you slice it, think long-term.
On the other hand, one can easy hit the first target for 130% or more within one month, short-term. If it doesn't work, try again, but you can't go wrong if you buy and wait. Notice the difference between current price and the all-time high... It is a nice chart setup, a nice trading opportunity; easy money, depending on your strategy, your thinking, your mindset.
If you are in too much a hurry, ok, you can secure a loss. If you have patience, you can end up with another win in the coming months. It is a great situation. Get ten like these and you set up yourself for success in the short-term. Once your targets hit, can take 3 months or 3 days, find a new set of charts. New opportunities are available every single day.
Take the time to take action. Take the time to choose; choose wisely, and the market will reward you with tons of profits; Crypto is here to stay.
Thank you for reading.
Your support is appreciated.
Namaste.

LAYERUSDTBullish trend continuation expectation
either take entry on break of HH
or take entry on fib 0.382 and put SL 0.6013

Sol layerOpened a short on Sol layer a while ago. Market likely to fall back towards support around $0.67 soon.
An aggressive break down from here is likely today in order to make new lows.
Stop: $0.75
Tp: $0.67
3RR
Time sensitive

Solayer 144% —The Fed Will Lower Interest Rates June 2025Endless opportunities this market has to offer. Even the same opportunity turns up over and over, again and again. If you missed it once, you can comeback and the market will opens its door for you to trade.
Easy win, easy buy, easy profits, easy hold, easy trade.
Solayer went even lower and matched the early March 2025 low prices. It can continue even lower before reversing so watch-out. It can also start moving right away. The trick is to buy and hold, not worrying about the short-term.
If the market wants to move lower, that's ok, we wait. If it moves higher, we have a win (green), this is also good, we wait for our target to hit to sell. You can use the target on the chart or you can aim higher is up to you.
If prices move lower, you can use a stop-loss or quit at a loss. No bueno.
If the market moves lower, it will recover because we are bullish now-long-term.
If the market was bearish, the overall market and cycle, then we wouldn't be talking about holding and long-term growth, we would be talking about taking profits and going home.
The Fed will lower interest rates later this month. This will create a major boom; Crypto is going up. You can more than double your capital with this pair. Endless opportunities the Cryptocurrency market has to offer.
Thank you for reading.
Namaste.

Layer dump not overJust recently opened a short position on later. It doesn't appear to me that the dump is over as the market keeps trending down making , the bears are still in strong and market broke pass prior levels that could have been used as a demand area. The fact that they broke shows weak demand so market will likely all lower until it reaches and area where its favorable for a lot of demand to come in.
That price is $0.7350- conservative price.
Main target is $0.67 area
Stop: $0.8 or higher.

$LAYER/USDT Technical Breakdown – April 11, 2025📈 $LAYER/USDT Technical Breakdown – April 11, 2025
We’re seeing a strong bullish structure forming on $LAYER as price breaks out of a prolonged accumulation phase and heads toward key resistance.
🔍 Chart Overview
Price Action: Price is currently trading at 1.9320 USDT, breaking out of the previous range highs around 1.70 USDT.
Structure: Higher lows and steady volume buildup signal healthy momentum. A textbook breakout scenario.
Support Zones:
First key support: 1.70 - 1.68 USDT (previous resistance, now turned support)
Major support: 1.35 - 1.40 USDT (trendline + previous demand area)
📌 Entry Ideas
Breakout Retest Entry: Watch for a potential pullback toward 1.70 USDT. If it holds, this could be a solid entry zone for continuation.
Aggressive Entry: Some traders might enter on continuation above 1.95 USDT with strong volume confirmation.
🎯 Upside Targets
Target 1: 2.20 USDT – Closest resistance, marked by the upper consolidation zone from the chart.
Target 2: 2.50 USDT – Mid-term level if bullish momentum continues.
Target 3: 3.00+ USDT – Psychological round number and historical high zone.
🧠 Trade Management
Stop-loss: Below 1.65 USDT, in case of failed breakout and close back inside range.
Risk Management: Position sizing according to risk/reward. R:R of at least 2:1 from retest entry.
📊 RSI Note
RSI is currently hovering around 70, showing strong momentum, but entering overbought territory – monitor for divergence or weakness on lower timeframes.
enjoy and good trading!

LAYER/USDTKey Level Zone: 1.0280 - 1.0350
HMT v8.1 detected. The setup looks promising, supported by a previous upward/downward trend with increasing volume and momentum, presenting an excellent reward-to-risk opportunity.
HMT (High Momentum Trending):
HMT is based on trend, momentum, volume, and market structure across multiple timeframes. It highlights setups with strong potential for upward movement and higher rewards.
Whenever I spot a signal for my own trading, I’ll share it. Please note that conducting a comprehensive analysis on a single timeframe chart can be quite challenging and sometimes confusing. I appreciate your understanding of the effort involved.
Important Note :
Role of Key Levels:
- These zones are critical for analyzing price trends. If the key level zone holds, the price may continue trending in the expected direction. However, momentum may increase or decrease based on subsequent patterns.
- Breakouts: If the key level zone breaks, it signals a stop-out. For reversal traders, this presents an opportunity to consider switching direction, as the price often retests these zones, which may act as strong support-turned-resistance (or vice versa).
My Trading Rules
Risk Management
- Maximum risk per trade: 2.5%.
- Leverage: 5x.
Exit Strategy
Profit-Taking:
- Sell at least 70% on the 3rd wave up (LTF Wave 5).
- Typically, sell 50% during a high-volume spike.
- Adjust stop-loss to breakeven once the trade achieves a 1.5:1 reward-to-risk ratio.
- If the market shows signs of losing momentum or divergence, ill will exit at breakeven.
The market is highly dynamic and constantly changing. HMT signals and target profit (TP) levels are based on the current price and movement, but market conditions can shift instantly, so it is crucial to remain adaptable and follow the market's movement.
If you find this signal/analysis meaningful, kindly like and share it.
Thank you for your support~
Sharing this with love!
HMT v2.0:
- Major update to the Momentum indicator
- Reduced false signals from inaccurate momentum detection
- New screener with improved accuracy and fewer signals
HMT v3.0:
- Added liquidity factor to enhance trend continuation
- Improved potential for momentum-based plays
- Increased winning probability by reducing entries during peaks
HMT v3.1:
- Enhanced entry confirmation for improved reward-to-risk ratios
HMT v4.0:
- Incorporated buying and selling pressure in lower timeframes to enhance the probability of trending moves while optimizing entry timing and scaling
HMT v4.1:
- Enhanced take-profit (TP) target by incorporating market structure analysis
HMT v5 :
Date: 23/01/2025
- Refined wave analysis for trending conditions
- Incorporated lower timeframe (LTF) momentum to strengthen trend reliability
- Re-aligned and re-balanced entry conditions for improved accuracy
HMT v6 :
Date : 15/02/2025
- Integrated strong accumulation activity into in-depth wave analysis
HMT v7 :
Date : 20/03/2025
- Refined wave analysis along with accumulation and market sentiment
HMT v8 :
Date : 16/04/2025
- Fully restructured strategy logic
HMT v8.1 :
Date : 18/04/2025
- Refined Take Profit (TP) logic to be more conservative for improved win consistency

Got Correction? Solayer Buy Opportunity (PP: ~600%)A correction is not the end. Remember, when prices drop in a bull market this truly becomes a buy opportunity...
Good evening my fellow Cryptocurrency trader, I hope you are having a very nice day.
Here LAYERUSDT went through a strong correction, a fast correction but that does not matter, it is actually good news because prices are back to baseline and low prices means a new opportunity to trade.
Prices are back to the level visited in mid-March and the correction was more than 70% strong. What does this means? This means that the correction is over and there is room for a new wave of growth.
We have a volume breakout and support is found at a higher low.
Keeping it simple, Solayer is ready to grow.
Namaste.

$LAYER Short-term OutlookBINANCE:LAYERUSDT | 6h
Showing signs of recovery after the sharp drop.
Key support: $0.90–$1 — needs to hold this zone
Immediate resistance: $1.26 — a break above could trigger a move to $1.60 to $2 (short-term target)
If $1 holds, short-term upside remains likely

Layer short to $0.79Just recently opened a short position on layer. This coin sold off heavily in past weeks but I still think it will fall lower as it keeps failing to find enough demand to support higher prices.
Stop: $0.9528
target: $0.79
potential partial at $0.87

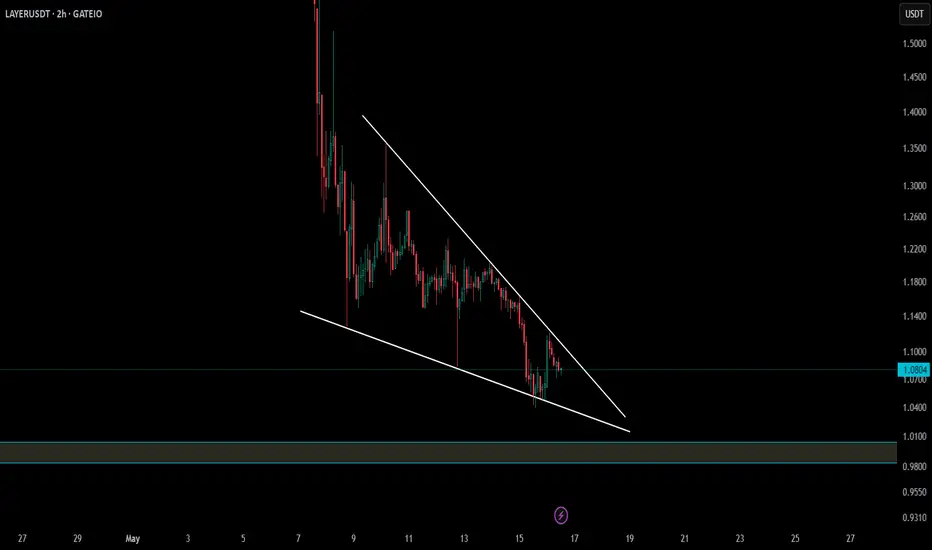
LAYER Falling Wedge Forming – Breakout Potential Ahead🚨 $LAYER – Falling Wedge Spotted
🕒 On the 2H chart, $LAYER is shaping a falling wedge — a well-known bullish reversal pattern 📈
⚡ A breakout with volume could kickstart a strong upside move, making this a setup worth watching.
👀 Stay alert — breakout confirmation might come fast!
$LAYER - Long Trade IdeaBINANCE:LAYERUSDT | 4h
Momentum’s turning, not a bad spot to punt a long. Who knows, they will send it to Valhalla
Key levels for potential targets:
tp1 - 1.20 to 1.35
tp2 - 1.60 to 1.90
tp3 - 2 to 2.20

Layer short to $1.06 areaWent short on layer just now. Based on how the weekly close prior, it failed to close above prior resistance which it could use as support. That simple factor suggest that the demand wasn't as strong else it wouldn't have closed below the prior resistance. Therefore I anticipate that the market will fall down to weekly support around $1.06 area to potentially use that area as support.
I got confirmation to short, however... still hesitating a bit to fall but am just let it playout and see what happens.

Layer Usdtprice are almost 60% down due to unlocking tokens
tomorrow it's last day of unlock.
almost 2 days prices are still in same zone which is good.
all sell pressure are out.
It's good project i hope after tomorrow it will be start
upward trend
Buy CP: 1.16 - 2.00
Sell: 3 or more
Spot Trade
long term maximum 1 month trade.
RSI also Bullish.

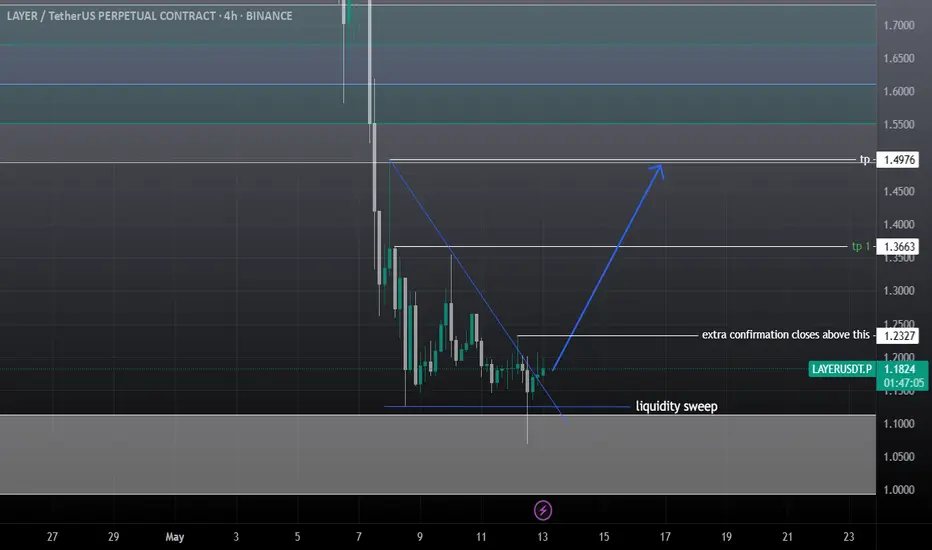
Layer, SOl Layer swing tradeAs 1 day & 4hrs candle failed to close below the previous one, it's following the liquidation sweep model, expectations are high that it will hit daily fvg at least 1.49$ manage your risk, the gray box is 1 day Bullish order Block, If btc hold the ground it will pump more.
LAYERThis project does not deserve to be watched, but at the end it is all about money.
What i want to say is, Layer has a crazy volume on 24h at Binance, so i think it has reached the bottom and my TP it will be around 1.65- 1.72$
Market conditions are perfect, so i think it will push up.
This is not a financial advice.
Please trade on your own risk.

Important PriceThis drawing is for educational purposes. I am publishing it as a note and development for myself. According to past support and resistance zones, the first target may be 1.69. Please adjust the Entry, Profit and Stop zones according to your own strategy. It is not an investment, buy or sell recommendation.

UndervaluedThis drawing is for educational purposes. I am publishing it as a note and development for myself. According to past support and resistance zones, the first target may be 1.69. Please adjust the Entry, Profit and Stop zones according to your own strategy. It is not an investment, buy or sell recommendation.

Layer/Usdt LONGI entered a position in LAYER at 1.40 USDT. This level was previously a strong support zone, both horizontally and within the ascending channel, making it a technically sound entry point.
My target is a potential move back to the 2.50 – 3.00 USDT range. However, I’m prioritizing risk management. That’s why I’ve set my stop-loss at 1.20 USDT, which is just below a key support level. If the price breaks below this, it could indicate further downside, so I’m prepared to exit the position.
My strategy:
Entry: 1.40 USDT
Target: 2.50 – 3.00 USDT
Stop-Loss: 1.20 USDT
Based on my technical analysis, there is a high probability of a rebound from this area. But in case of further breakdown, I’ll manage my risk accordingly with this plan.

Sol Layer scalp shortThis token is dumping off aggressive. Not sure whats the cause behind but based on my analysis it has the potential to fall even lower down to $1.2940 so looking to take advantage of the momentum. I did see it a bit early so entry and invalidation stop not optimal but lets see how it roughs. Roughly 2 RR. I might exit earlier. Depends on the PA
