TradeCityPro | LDO Breaks Out Amid Altseason Hype Shift👋 Welcome to TradeCity Pro!
In this analysis, I’m going to review the LDO coin for you. It’s one of the well-known DeFi projects in crypto with the highest TVL in this category, and the LDO coin ranks 82 on CoinMarketCap with a market cap of $1.08 billion.
📅 Daily timeframe
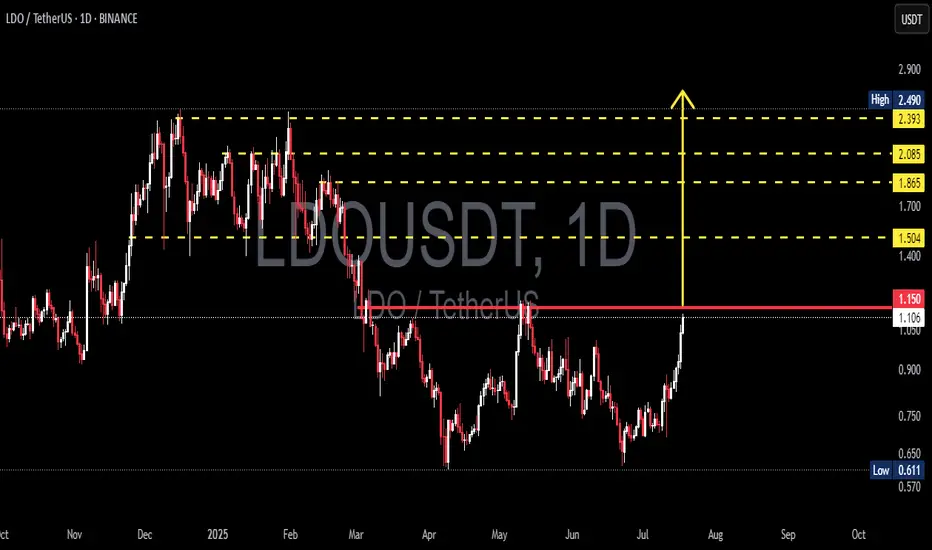
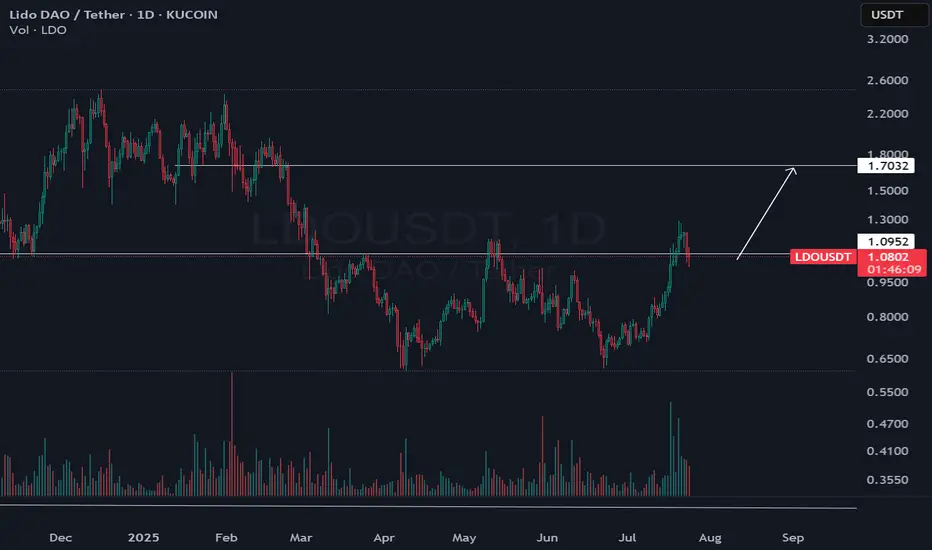
On the daily timeframe, LDO has been in a range box for several months and is now starting to break out of it.
💥 After being supported at the 0.683 bottom, a large amount of buying volume entered, and a sharp bullish move occurred from this bottom to the top of the box. The RSI has also entered the Overbuy zone.
🔔 The overextended level on the RSI oscillator is 79.66, which has even been broken during this leg. Right now, I think the probability of a correction is quite high.
🔍 Yesterday's candle made a deep penetration into the top of the box, and currently, the price is sitting above the box. Since RSI is in the overextended zone, a pullback or short-term rest is likely.
🚀 However, considering the current uptrend, I believe this bullish leg might be ending, and we could see a few corrective candles. But after the correction ends, a new bullish leg might begin, pushing the price toward the resistance levels at 1.480 and 2.382.
🛒 For a long position or a spot buy, we can enter during this new bullish leg once the top breaks and a confirmation of a new wave starting is in place.
📝 Final Thoughts
This analysis reflects our opinions and is not financial advice.
Share your thoughts in the comments, and don’t forget to share this analysis with your friends! ❤️
LDOUSDT trade ideas

LDO/USDT Breakout Watch Ready to Fly After a Strategic Breakout?🔍 Full Technical Analysis
After months of downtrend and tight consolidation, LDO/USDT is showing clear signs of a bullish resurgence. The breakout above the key psychological resistance at $1.15 opens up a wide path toward higher resistance zones, potentially marking the beginning of a strong upward trend.
📐 Key Pattern Formed:
✅ Double Bottom Pattern
> Clearly visible from May to July 2025, with a neckline at $1.15. This is a classic bullish reversal pattern. The breakout above the neckline confirms the setup, projecting a significant upward move based on the measured height of the pattern.
✅ Horizontal Resistance Breakout
> The $1.15 level acted as a major resistance since April 2025. A clean breakout above it suggests that bulls are regaining control of the market momentum.
✅ Bullish Scenario (Primary Bias)
If the price successfully holds above the $1.15 zone and confirms it as support (successful retest), we may witness a bullish rally targeting the following levels:
🎯 Target 1: $1.504
— A minor resistance and previous consolidation area.
🎯 Target 2: $1.865
— A strong resistance level from earlier distribution zones.
🎯 Target 3: $2.085
— A technically significant level and key reaction point from past price action.
🎯 Target 4: $2.393 – $2.490
— A major supply zone and swing high from early 2025. This serves as the potential final target of the current bullish leg.
🟢 Volume increased during the breakout — a strong confirmation signal that this move is genuine, not a fakeout.
🟢 RSI likely gaining strength — though not shown on this chart, momentum indicators are likely supporting the move with a breakout from neutral levels.
❌ Bearish Scenario (If Breakout Fails)
If the price fails to hold above $1.15 and drops back below $1.05:
🔻 Potential Fakeout Risk
— A correction could send LDO back to:
Minor support at $0.90
Base support at $0.75
Major support at $0.611 (2025’s low)
📉 A breakdown below $0.611 would invalidate the bullish structure entirely, putting LDO back into a strong downtrend.
📊 Final Thoughts:
> LDO/USDT is at a critical decision point. A clean breakout from a strong medium-term structure opens the door for a significant bullish continuation. With pattern confirmation and strong volume support, this setup could mark the beginning of a mid-term uptrend.
The key lies in holding above $1.15 and watching for a healthy retest. This is a premium setup for swing traders and trend followers looking for early entries before a possible major move.
🧠 Trading Tips:
✅ Ideal Entry: On successful retest around $1.15 – $1.10
❌ Stop Loss: Below $1.00
📈 Targets: $1.50, $1.85, $2.08, and $2.49 (scaling out recommended)
#LDO #LDOUSDT #CryptoBreakout #AltcoinRally #TechnicalAnalysis #DoubleBottom #CryptoSignals #TradingViewIdeas #SwingTradeSetup #BullishPattern
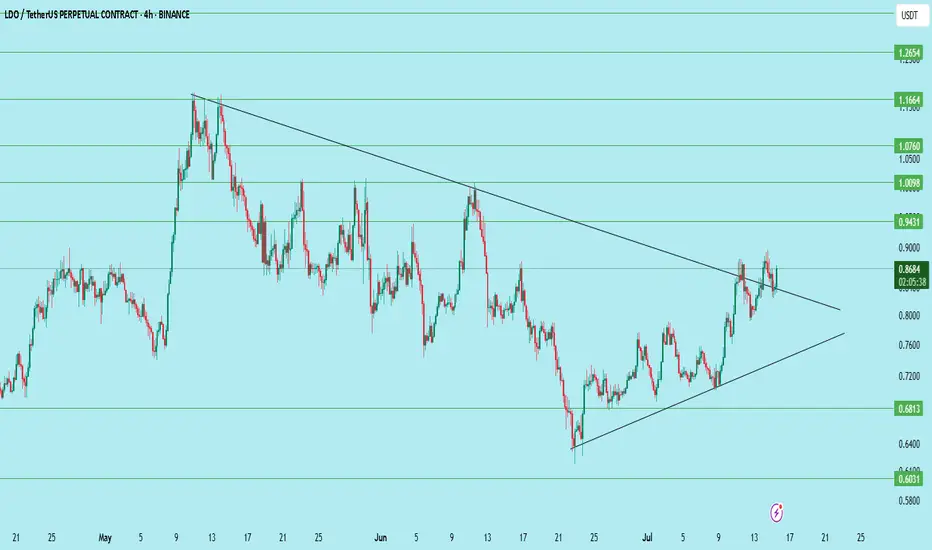
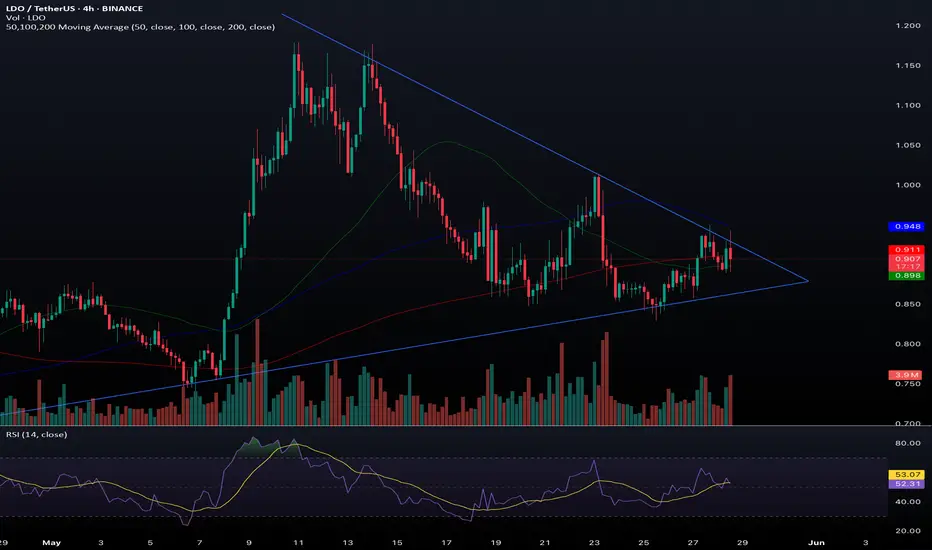
LDO/USDT – Symmetrical Triangle Breakout SetupLDO is trading just below a major downtrend line and forming higher lows, compressing into a symmetrical triangle. A breakout looks close!
Chart Insights:
Price approaching resistance around $0.87–$0.88
Strong structure of higher lows holding since June
A breakout above the trendline can trigger a strong move
Trade Setup:
Entry: On breakout above $0.88
Stoploss: Below $0.81
Targets:
T1: $0.943
T2: $1.009
T3: $1.076
T4: $1.166
T5: $1.265
Good volume confirmation will strengthen the move. Watch closely!
DYOR | Not financial advice
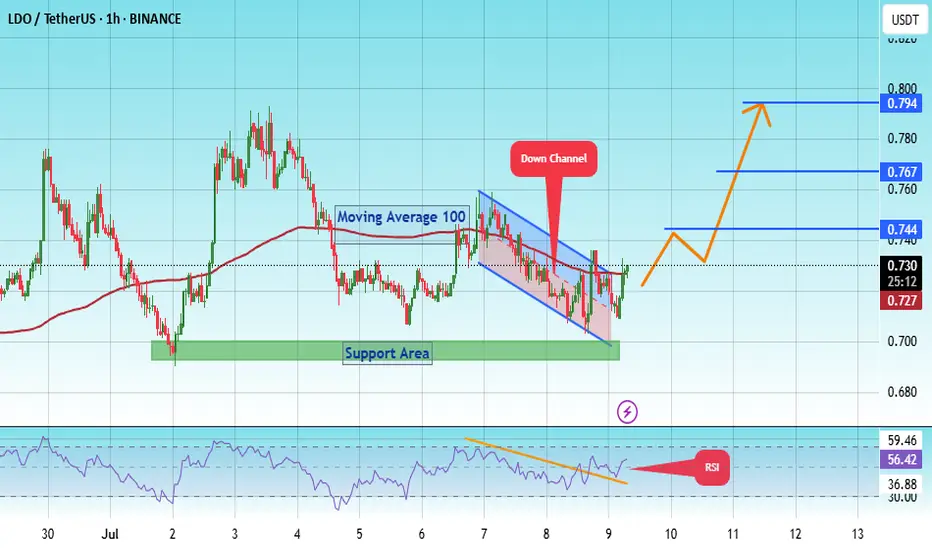
#LDO PUMP TO $ 0.794 ?#LDO
The price is moving within a descending channel on the 1-hour frame, adhering well to it, and is on its way to breaking it strongly upwards and retesting it.
We have a bounce from the lower boundary of the descending channel. This support is at 0.703.
We have a downtrend on the RSI indicator that is about to break and retest, supporting the upside.
There is a major support area in green at 0.695, which represents a strong basis for the upside.
Don't forget a simple thing: ease and capital.
When you reach the first target, save some money and then change your stop-loss order to an entry order.
For inquiries, please leave a comment.
We have a trend to hold above the 100 Moving Average.
Entry price: 0.730
First target: 0.744
Second target: 0.767
Third target: 0.794
Don't forget a simple thing: ease and capital.
When you reach the first target, save some money and then change your stop-loss order to an entry order.
For inquiries, please leave a comment.
Thank you.
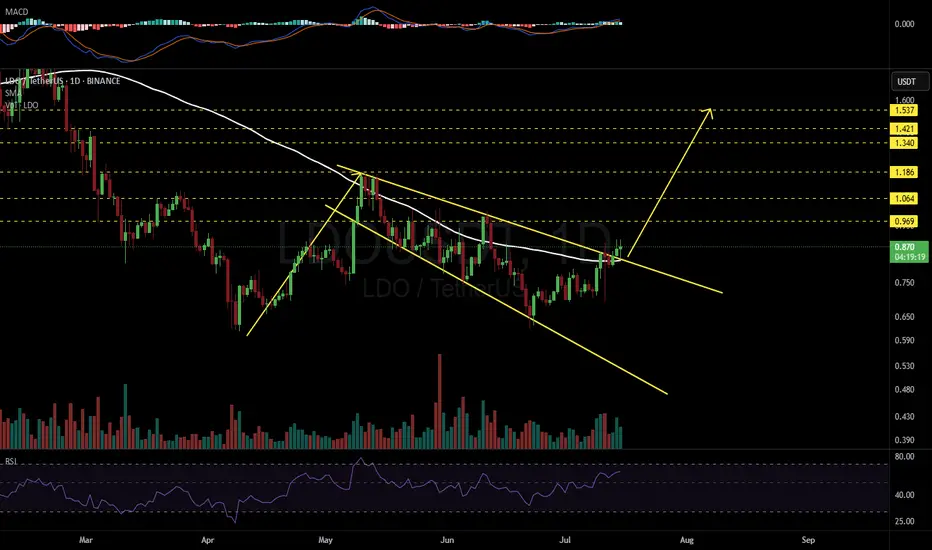
LDOUSDT 1D#LDO has broken above the Descending Broadening Wedge pattern and the SMA100 on the daily chart. The retest is nearly complete.
If the daily candle closes above the pattern, the following targets are on the table:
Targets:
🎯 $0.969
🎯 $1.064
🎯 $1.186
🎯 $1.340
🎯 $1.421
🎯 $1.537
⚠️ Always use a tight stop-loss and apply proper risk management.
Ldo setupCrypto will have another long leg and according to my comprehensive analysis, this pump to the $1.7 range could happen for Lido.
#LDO/USDT#LDO
The price is moving within a descending channel on the 1-hour frame, adhering well to it, and is on its way to breaking strongly upwards and retesting it.
We have support from the lower boundary of the descending channel, at 1.128.
We have a downtrend on the RSI indicator that is about to be broken and retested, supporting the upside.
There is a major support area in green at 1.10, which represents a strong basis for the upside.
Don't forget a simple thing: ease and capital.
When you reach the first target, save some money and then change your stop-loss order to an entry order.
For inquiries, please leave a comment.
We have a trend to hold above the 100 Moving Average.
Entry price: 1.139.
First target: 1.172.
Second target: 1.210.
Third target: 1.270.
Don't forget a simple thing: ease and capital.
When you reach your first target, save some money and then change your stop-loss order to an entry order.
For inquiries, please leave a comment.
Thank you.

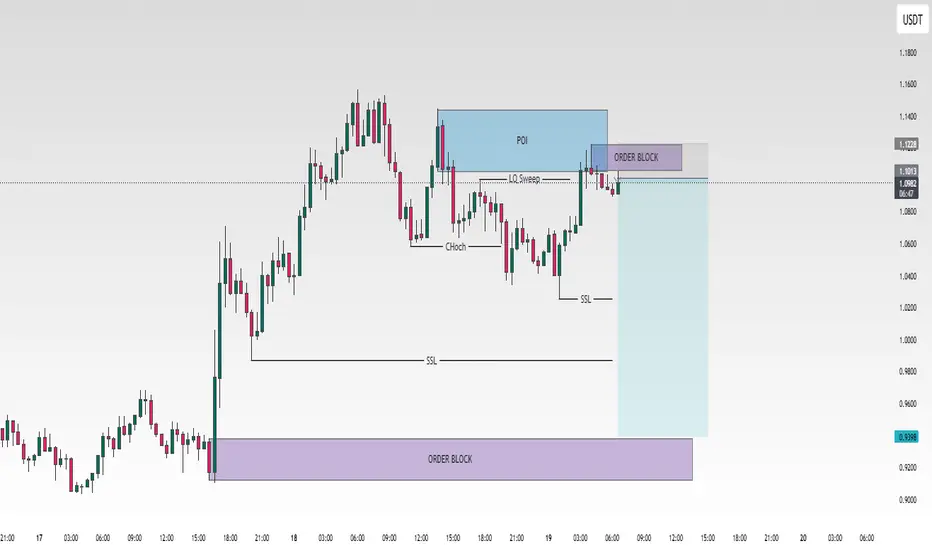
LDO Short ideaLDO short idea using SMC concept
price done sweep the liquidity, mitigated the POI and form a new OB, from that OB i am entering a short position
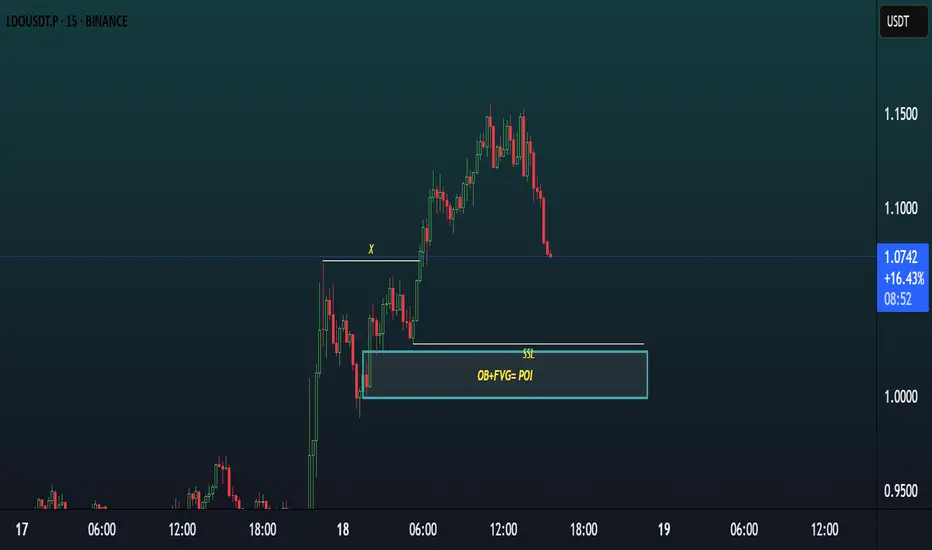
LDO TRADE IDEA AND SETUP FOR TRADE.Chart Overview
Pair: LDO/USDT Perpetual
Timeframe: 15 Minutes
Current Price: 1.1044
Market Bias: Bullish (anticipating a pullback into OB+FVG zone before continuation)
📌
Setup Summary
Strategy: Smart Money Concept (SMC)
Key Confluences:
Order Block (OB)
Fair Value Gap (FVG)
SSL (Sell-Side Liquidity) sweep
POI Zone (Point of Interest): Around 1.000–1.020
🧠
Detailed Breakdown
1.
Break of Structure (BoS)
A strong bullish break of structure occurred after price took out the previous swing high (marked as “X”).
This confirmed a shift from bearish to bullish market structure.
2.
SSL (Sell-Side Liquidity)
Before the price moved up, it took out liquidity resting below previous lows.
This SSL sweep often fuels institutional moves — confirming a smart money entry zone below.
3.
OB + FVG = POI
The blue box highlights a powerful confluence of:
A Bullish Order Block (OB) (last down candle before up move)
A Fair Value Gap (FVG) (imbalance created by fast move)
This makes the zone high probability for reversal, if price returns to it.
4.
Price Action
Price is now retracing, and if it fills the imbalance into the POI zone, it is likely to react bullishly.
The next leg up can retest or break the highs above 1.22+.
✅
Entry Tips
Wait for a bullish engulfing candle or market structure shift in 5m inside POI.
Use volume spike or RSI divergence for stronger confirmation.
🧩
Conclusion
This is a clean Smart Money bullish setup combining:
SSL liquidity sweep
Order Block
Fair Value Gap
And a likely retracement into POI
Highly favorable setup for a long position with solid risk management.
LDO/USDT Long-Term Accumulation Opportunity LDO/USDT Long-Term Accumulation Opportunity 🤝🎖️
On the daily timeframe, LDO is currently forming a potential double bottom pattern, signaling the exhaustion of its prolonged downtrend. This structure often acts as a strong reversal signal, especially when supported by a clear horizontal demand zone.
📉 Short-Term Price Action
There is still a possibility of a minor dip toward the support zone of $0.66–$0.60, where significant buying interest is likely to emerge.
🫡 Mid-to-Long Term Outlook
From this accumulation range, LDO holds potential for a strong upside move
1X to 3X returns possible over the next few quarters.
Major resistance zones lie around
$1.90–$2.80, which aligns with historical liquidity zones🤝.
📌 Investor Note
This setup is favorable for long-term portfolio positioning, especially for those looking to accumulate fundamentally promising altcoins on market consolidation.
Risk management remains key. Accumulate gradually near the support zone and avoid emotional entries on short-term pumps.

LDO/USDT — Reversal in the Making?Lido Finance is a major decentralized liquid staking protocol. It allows users to lock ETH and receive stETH, which can then be used across various DeFi platforms.
🔍 Technical setup:
▪️ Price is moving inside a broad horizontal range with wicks in both directions
▪️ Within that, there’s a secondary descending channel
▪️ Currently forming a potential double bottom or dragon pattern — both are classic reversal setups
📌 Key confirmation level:
▪️ A breakout and close above 0.922 USDT would confirm the pattern and signal possible trend reversal
🎯 Upside targets if breakout confirms:
▪️ 1.77 — short-term target
▪️ 2.57 — mid-range resistance
▪️ 3.90 and beyond — long-term potential
⚠️ As long as price remains inside the range — it's just preparation.

$LDO PUMP TO $1.20📊 1. Trend Analysis
HTF (Higher Time Frame) Bullish: Long-term trendline shows sustained upside momentum with 3 clean touches, indicating trend strength.
LTF (Lower Time Frame) Bearish: Short-term structure broke down from the trendline but is now showing signs of reversal with a falling wedge breakout.
📈 2. Chart Pattern
Falling Wedge: Classic bullish reversal setup. Price has broken out with strong momentum.
OBV (On-Balance Volume) shows bullish divergence—volume is rising while price was falling, signaling accumulation during the downtrend.
🔄 Market Structure
Swing Highs and Lows are respected—showing healthy structure.
Recent swing low held near the demand zone.
Break and retest of key levels and trendlines indicate potential continuation to the upside.
🟪 Supply & Demand
Demand Zone (~$0.65): Provided strong support, origin of latest move.
Supply Zone (~$1.15): Likely to offer resistance; aligns with upper FVG and volume gap.
🔵 Fair Value Gaps (FVGs)
Filled/Partial Below: $0.65–$0.68 – already mitigated.
Unfilled Above: Around $0.98–$1.05 – may act as a magnet for price.
🧠 Psychological Levels
$0.90 and $1.00: Price magnets due to trader behavior. Expect increased reaction or consolidation at these levels.
🔴 Volume Profile
High Volume Node (HVN) around $0.85–$0.95: Indicates acceptance zone where price may consolidate.
Low Volume Gap above $1.10: If price clears this, a fast move to $1.20+ is likely.
✅ Bullish Confluences
Falling wedge breakout confirms reversal potential.
OBV divergence supports accumulation narrative.
Price bounced from demand zone and reclaimed broken structure.
Room to move into FVG and low-resistance areas above.
❌ Bearish Risks
Rejection at $1.00–$1.05 psychological/FVG level.
Breakdown below $0.86–$0.88 invalidates bullish setup.
Heavy supply at $1.20 could cap upside.
📌 Summary
Bias: Bullish. Expect move toward $1.00–$1.15.
Confirmation: Clean break and hold above $1.00.
Invalidation: Break back below $0.86 swing low.

#LDO/USDT#LDO
The price is moving within a descending channel on the 1-hour frame, adhering well to it, and is heading toward a strong breakout and retest.
We are experiencing a rebound from the lower boundary of the descending channel. This support is at 0.741.
We have a downtrend on the RSI indicator that is about to be broken and retested, supporting the upward trend.
We are in a trend of consolidation above the 100 moving average.
Entry price: 0.780
First target: 0.805
Second target: 0.837
Third target: 0.870

LDO is bullishHere is the LDO picture and I want to explain why it is offering buying opportunities right now: The price had a big move to the downside and broke out of the bracket on lower volume than it can be found within the bracket. So being below the bracket is not the time to sell. We can also see that aggressive short-term sellers were in control to liquidate the longs. A lot of longs could have been found on the previous move to the upside, that lead the price into the pmProfile. So the 4 hr low on the left, that got taken out on this move to the downside, was the origin of the previous bullish move. This was the FTR draw (liquidity grab). Aggressive short-term sellers always compete against long-term buyers. The LTB will always win. It is just a matter of time and to find a good spot, when the market will be depleted of selling potential. It won´t be able to go any lower and the shorts will get squeezed afterwards. If we look at the 4 hr price structure, I don´t think that´s a lower high downtrend structure. It is really a bracket with some proper downside deviations. Once the market is depleted of selling potential, we can expect a full move to the high of the bracket and eventual a proper deviation of the bracket. So a full rotation of the pmProfile is very likely imo. In the local picture we can see low volume bracketing but then many aggressive sellers came in once more even after the strong downtrend. So far they were not even able to take out the low which could be a sign that the market can not go any lower right now on LDO. So really: 1) below the bracket 2) below the monthly (support) liquidity 3) below the pwProfile 4) at the lower end of the developing pwProfile which is b-shaped (short-term sellers against long-term buyers, LTB will always win in the end 5) below the pmProfile 6) local shorts can not even take out the low. Give this baby some time and then ride it.

Lido DAO Awakens While Aiming At 900%+, EasyLido DAO has been sideways for three long years and is currently trading at bottom prices. The best possible ever for buyers, traders, long-term holders or simply all those looking to make good profits with Cryptocurrencies, the time is now.
Here we can see how price action matches perfectly the support zone that was tested in August-November 2024, Nov-December 2022 and June 2023. True bottom prices.
It is also easy to notice a huge increase in trading volume after mid-2024. This means that after this date LDOUSDT traders became active which tends to happen before strong market action.
Now, there has been some bearish action but also bullish, "long-term sideways consolidation," and this is coming to an end. The next move is a bullish move and signals the start of the 2025 bull market for this pair.
Some pairs are already growing while others are still moving lower. Since it will take 6-12 months for the full bull market to unravel, it is normal to see some down while others are up.
This project will be a big one. This pair will produce massive growth.
Here we have a great price and great entry timing.
I am wishing for you the best.
Thanks a lot for your continued support.
Namaste.

Wait to buy LDOLido DAO remains a dominant force in Ethereum staking with a robust revenue mechanism and expansive ecosystem integration.
Strengths:
Top liquid staking provider with deep DeFi utility and strong revenue model
Centralization & governance concentration
High-APR staking rewards (~3–4%) with liquidity via stETH
Risks
Potential stETH–ETH price divergence
DAO-driven risk management and validator distribution
Smart contract & protocol execution risks
A buy zone for LDO is identified between $0.40 and $0.50. The detailed setup is illustrated in the chart.
Disclaimer:
This analysis is based on my personnal views and is not a financial advice. Risk is under your control.

LDO - Next Impulse Starting Soon!Hello TradingView Family / Fellow Traders. This is Richard, also known as theSignalyst.
After breaking above the $0.8 major high, LDO has shifted from bearish to bullish from a long-term perspective. 📈
This week, it has been undergoing a correction phase within a falling channel marked in red. 🔻
For the bulls to take over and kick off the next impulsive wave toward the $1.5 mark, a breakout above the upper red trendline is needed. 🚀
📚 Always follow your trading plan regarding entry, risk management, and trade management.
Good luck!
All Strategies Are Good; If Managed Properly!
~Rich

LDO S/R reclaim setupBINANCE:LDOUSDT has reclaimed a key 4H support/resistance zone around $0.86–$0.85. This level previously acted as a pivot, and the successful reclaim signals renewed bullish intent.
Entry Zone:
🟩 $0.83–$0.86 (Buy zone)
• Setup activated on reclaim of S/R
• As long as price holds above $0.83, structure favors upside
• Invalidation on clean break below $0.83
🎯 Target:
• First resistance: $1.02
• Additional supply zones lie above for partial profit-taking
Plan:
• Long position valid while price holds above reclaimed S/R
• Invalidation below $0.83 — structure would shift bearish
• Scalp-to-swing setup depending on reaction at $1+
📌 Clean level reclaim + bullish structure = solid R:R opportunity.

LDO ROADMAPTo me the view is pretty clear.
* The purpose of my graphic drawings is purely educational.
* What i write here is not an investment advice. Please do your own research before investing in any asset.
* Never take my personal opinions as investment advice, you may lose your money.
LDO 3D LONGBINANCE:LDOUSDT is carving out a higher-low on the 3D chart right at critical support—prime setup for a swing long.
1. Context & Structure
• Tested & held the monthly support zone around $0.876–$0.883
• False break below followed by quick reclaim—sign of seller exhaustion
• Forming a “cup-and-handle” style recovery after prolonged sell-off
• Market-wide altcoin bottoming in sync
2. Key Levels
• Buy Zone: $0.876–$0.883
• Stop-Loss: weekly close or 3D close below $0.701
• Take-Profit 1: $1.413 (next 3D swing high & supply zone)
• Take-Profit 2: $4.036 (upper range / untapped highs)
3. Trading Plan
– Primary: Scale in full position across $0.876–$0.883; trail stop below $0.701
– Alternate: If price dips back to $0.701 & reclaims quickly, consider re-entry on the reversal
4. Triggers
– Bullish 3D close above $0.883 with volume spike
– Sweep of $0.876 with fast recovery above $0.883
– Broad altcoin strength confirming synchronized bottom
As long as $0.876 holds, the mid-term long thesis stays valid. Targets at $1.413 and $4.036 offer 61% & 359% upside, respectively. Trade the confirmed bottom—patience and discipline win. 🚀

LDO long "@members
Leverage: 5-10x
Capital risk: <3-4%
Entry: market buy (DCA around 0.9499 - 0.8803 )
Sl: 0.8288
Tp1: 1.1513 - 1.2280
Tp2: 1.3995 - 1.4761
Tp3: 1.8995 - 1.9761
LDO about to print bullish 50EMA cross probs in next 2-3 12h candles, holding quarterly open and blu box with head and shoulders pattern (imo since they are a bit subjective)...entered and will let it run want to see conformation on EMAs + trend lines
"

LDO Shortchart indicating LDO short from Kairo suggestions
RSI - ATR, VOL, & candle returns (4H - 6 rolling, 1D - 7 rolling, 1W - 4 rolling)
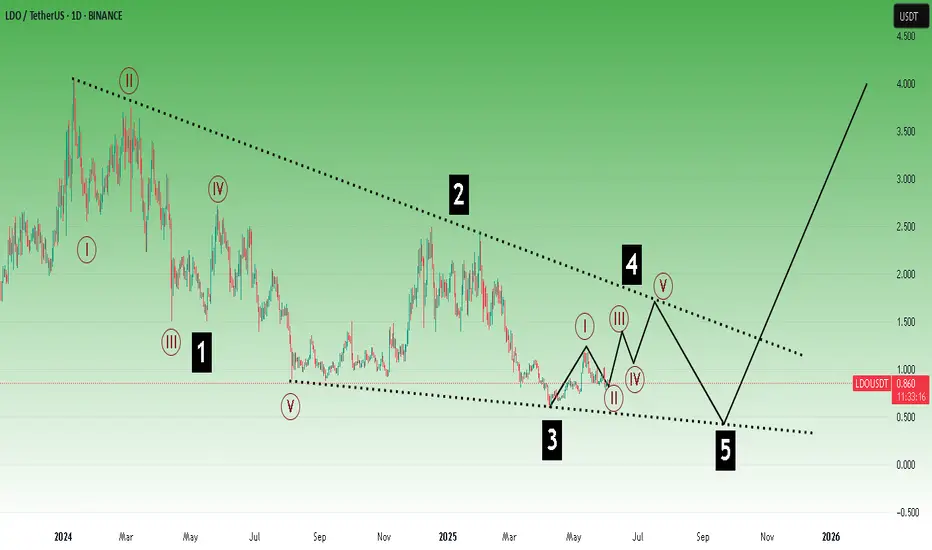
LDO Is About To ExplodeHello, Skyrexians!
Today I make an update on BINANCE:LDOUSDT which I hold on spot with average price at $0.8. First of all I will clarify how this bullish forecast can match with my yesterday's analysis about altcoins drop. Easily! There was the 2D time frame - mid term analysis. This is weekly chart. I can allow that some drop is possible for Lido Dao or other alts but global picture will be the same.
On the chart some of you will see the accumulation. In fact this is very long wave 2 ABC shaped. It's not interesting to tell about waves A and B. The only one thing is important is that now wave C in 2 is finished with the divergence between waves 3 and 5. Next wave shall be insane and reach very high, above $6.
Best regards,
Ivan Skyrexio
___________________________________________________________
Please, boost this article and subscribe our page if you like analysis!
