LDO LOOKS BULLISHIt seems that the LDO symbol is inside a large diametric pattern. It is not far to expect that it will be inside a diametric. In the last few months, all altcoins have been in complex patterns.
After completing the g wave of D , For branch E, it can move up to the specified targets and then be rejected downwards
For risk management, please don't forget stop loss and capital management
Comment if you have any questions
Thank You
LDOUST trade ideas

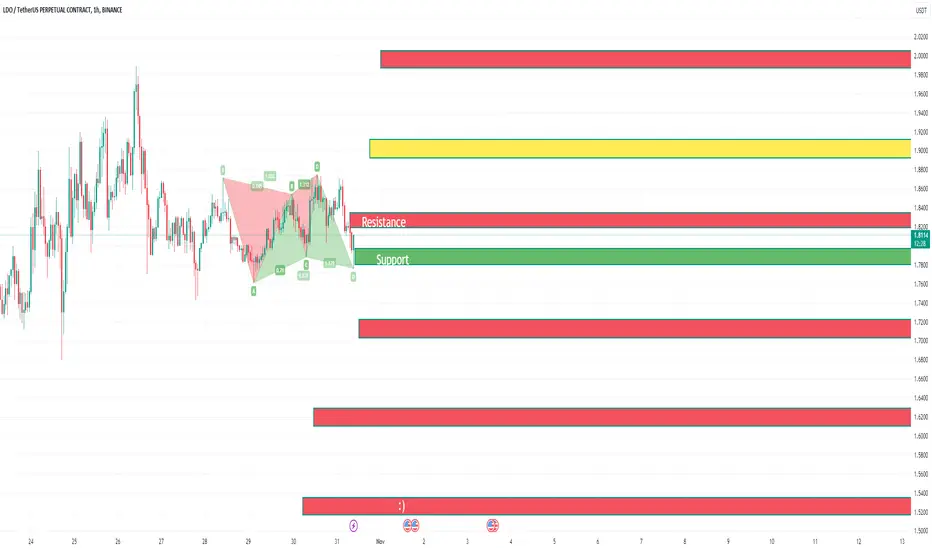
Lido DAO's (LDO) Bullish MomentumLido DAO continues to exhibit an upward trend, having increased by 33% since October 20.
Nevertheless, LDO is currently trading sideways, fluctuating between the $1.72 and $1.93 levels. If the market maintains its positive momentum, the coin may have the opportunity to retest the psychological threshold of $2 and approach the subsequent resistance level at $2.11.
In the event of a correction, Lido DAO buyers might become more active within the support zone ranging from $1.72 to $1.79, or even at the $1.65 level. A drop below these levels seems unlikely at this juncture unless BTC experiences a significant decline.

LdoHasn't moved on the monthly yet..
Soon tm*
Macd curling up, volume building just below resistance
Obv exponentially bullish price is in a flattish range... so there's some kind of divergence going on there
Volumes building so I doubt the obv trend changes anytime soon... alts popping and I doubt one of the most highly rated new fundamental narratives (lsds) will miss the markup phase were seeing right now for other projects

LDO prepair for going upThe price formed a support base in the range of $1.46-$1.73.
Based on the current market situation, purchases can be considered either at current price values, or after waiting for a correction to the upper limit of the support range of $ 1.73
The profit potential in case of price movement to the first resistance zone of $2.36-2.66 is more than 50%

Ldo confusedLdo confused, still in a sideways area and the harmonics confirm it.
Just slide along until she decides.
Ldo experimental chartLdo experimental chart.
This signals just appear on my charting methods. This is an experimental method and don`t know yet what these mean :))

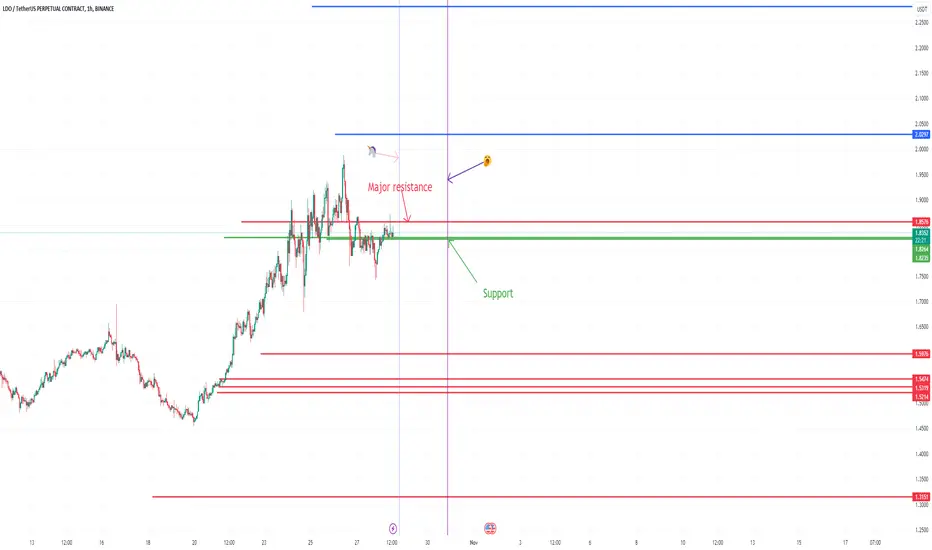
#LDO/USDT is trying to hold Diagonal Trendline and a support lev#LDO/USDT is trying to hold Diagonal Trendline and a support level in 1-Hour TF!
MIL:LDO is holding PDL $1.781 as a support level. The next support level is PMH $1.7245. Breakdown below the support will be a bearish sign.
The local resistance level is PDH $1.99.
LONG LDO?BYBIT:LDOUSDT.P looking good!
---
I set a pos here. LONG LDO
Entry: around 1.781
Stoploss: 1.757
TP1: 1.86; TP2: 1.9;
---
Handle your risks, if you dont know, try to check my post below.
DYOR

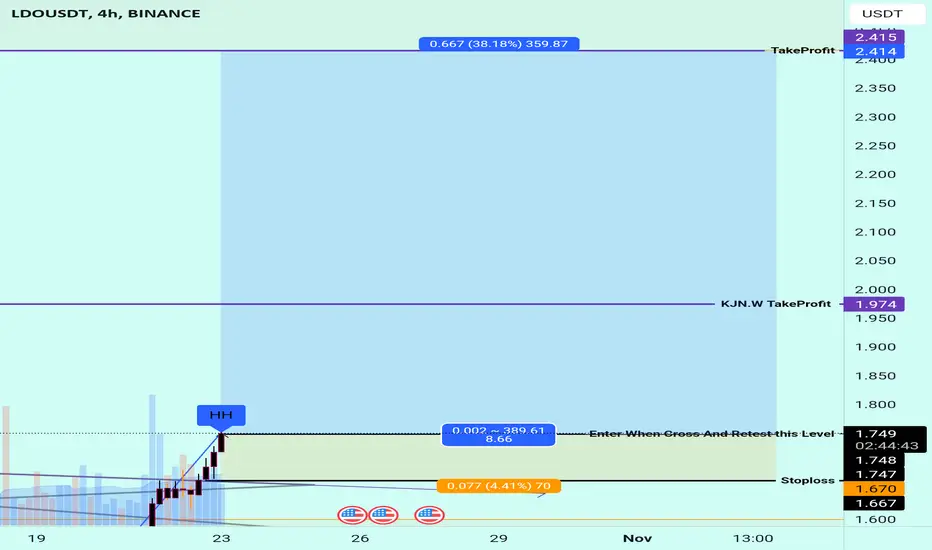
LDOUSDT Long Trade!LDOUSDT Technical Analysis Update!
Buy zone : Below $1.75
Stop loss : $1.67
Take Profit 1 : $1.82
Take Profit 2 : $1.98
Take Profit 3 : $2.26
Always Keep StopLoss
Thanks
Hexa

LDOUSDThink this one shoots to aths from here tbh...
Was highest or in the top few tvl of the liquid staking derivatives for most of the bear market..
Will be a strong narrative this year think this outperforms similarly to oracles/synthetix/crosschainbridges last bear market..
LDO Buy Trade Blueprint: Seizing the Moment for Maximum Gains **Short fundamental analysis of LDO coin:**
Lido DAO (LDO) is a decentralized autonomous organization (DAO) that provides liquid staking services for Ethereum. Lido allows users to stake their ETH without having to lock them up in a smart contract, and they earn staking rewards in the form of stETH, which is a liquid token that can be traded on exchanges.
LDO is the governance token of Lido DAO. It is used to vote on proposals to change the protocol, and it also gives holders a share of the fees generated by Lido.
**Recent news about LDO coin:**
* On October 18, 2023, Lido announced that it had raised $70 million in a Series B funding round led by Paradigm.
* On October 20, 2023, Lido announced that it had integrated with the Optimism Layer 2 scaling solution. This will allow Lido users to stake their ETH on Optimism and earn staking rewards at a lower cost.
However, I am not a financial advisor and I cannot provide financial advice. Please do your own research before making any investment decisions.
Is Lido's bullish reversal likely? Lido’s pullback is headed to previous support and H12 bullish OB at $1.50 and could provide buying opportunities. A bullish reversal and successful hit on $1.6 could present a 6.5% profit.
Entry: $1.50
Take-profit: $1.60
Exit: $1.47
RR: 3

LDOUSD ❕ fallingLDO broke below 200EMA (4H TF)
50EMA crossed downwards through 200EMA (30m TF)
RSI is moving in the bearish zone.
I believe that the chart will continue to decline if it fixes under the support level.


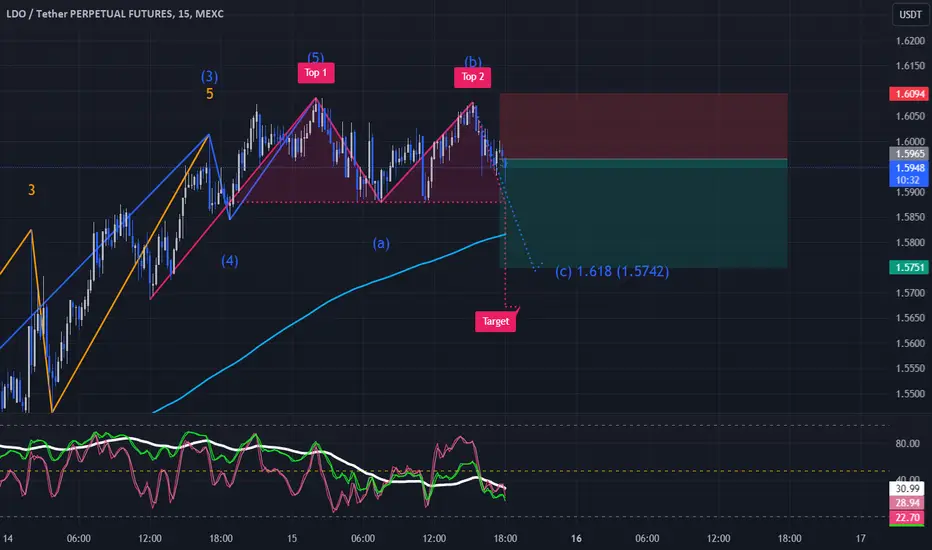
Short Trade on LDO/USDT.PFound this second opportunity for today
based on Double Top again, and Elliot wave Pattern
Risk to Reward Ratio is 1 : 1.59
MEXC:LDOUSDT.P
LDO is inside a large falling patternLDO is forming a large descending triangle.
After the diametric completion of the large wave D, we will have an upward movement for wave E and then the triangle will be completed and we will drop down.
This is a normal E wave. The E wave may be shortened. You have to get a trigger and confirmation, but in our opinion, the structure is like this.
For risk management, please don't forget stop loss and capital management
Comment if you have any questions
Thank You

LDO the decentralized Autonomous OrganizationFalcon X withdraws 5.25 million LDO (Worth $8.13 million)from Binance in the past three days, leaving them with a remaining holding of 7.01 million LDO (valued at $10.94 million) as of the time of writing.
Because of this single act the price of LDO simultaneously surged with a 3% percent gain

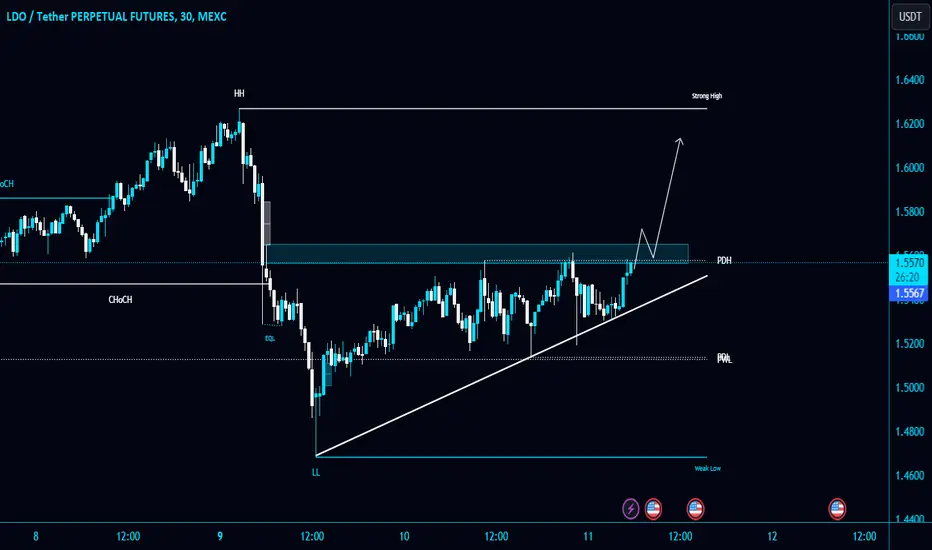
#LDO/USDT is testing the PDH resistance zone in 30-Minuts TF!#LDO/USDT is testing the PDH resistance zone in 30-Minuts TF!
Expecting a bullish momentum in case of Breakout and retest. Wait for BO/retest to open a Long position in $LDO.
The strong support level is PDL $1.5120.
LDOUSDT insight position tradeThis token can possible go into this price only if it respects the demand zone. Price shows good sign even on the higher timeframe.

Accumulation plan for LDOLDO, which stands for "Lido, a Delegated Proof of Stake (DPoS) staking protocol for various cryptocurrencies, including Ethereum (ETH) and Terra (LUNA). Lido aims to provide liquidity to users who stake their tokens on these blockchains.
In my opinion, LDO is forming an interesting pattern, the accumulation schematic following Wyckoff method.
As in chart, the yellow area would be a good place to buy LDO. So it's still soon to accumulate it.
What do you think about LDO and this plan?

45% and moreThere are two trend lines first one is broken and second considering Tp1 will be broken and touch Tp2.

LDO PLANThese are the possible LDO trade plans as of now. Will wait for any of the three scenarios to get activated, and look for the entries
