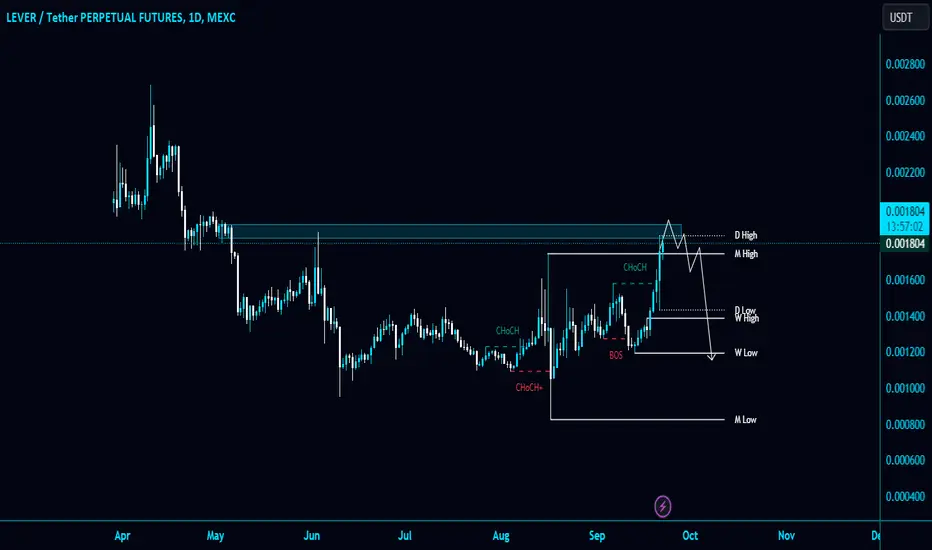
Short idea for the coming weekHello traders, I would like to share with you this idea that I found on the LEVER token. We can see that price has rejected an important resistance today and with the strenghtning of the US Dollar, we could see a drop in price. The targets i monitor are drawn on the chart...
LEVERUSDT trade ideas


#LEVER/USDT is testing the major supply area in Daily TF!#LEVER/USDT is testing the major supply area in Daily TF!
I am expecting a rejection from there. $LEVER $0.001745 is holding PMH as a support breakdown, this support is bearish.
✴️ LeverFi | Final Friendly Reminder (Targets Incl.)I mentioned being extremely bullish on this pair, LEVERUSDT, and it seems the chart is only getting stronger.
Really high volume as all resistance is being removed.
This is a friendly reminder, this Altcoin is about to move up strong.
Sooner rather than later.
Targets on the chart and through previous trade ideas (below).
Namaste.

Lever On Fire: Don't Miss Out on This Buy Trade!"Lever Coin (LEVER) is the native token of LeverFi, a decentralized margin trading protocol. LeverFi allows users to trade cryptocurrencies with up to 50x leverage. LEVER is used to pay for trading fees, to govern the LeverFi protocol, and to stake for rewards.
LeverFi is a relatively new protocol, but it has quickly gained popularity due to its innovative features and its focus on security. LeverFi uses a unique risk management system to protect users from liquidations, and it is the first margin trading protocol to offer insurance against hacks and smart contract exploits.
LEVER has a total supply of 100 billion tokens, and it is currently trading at around $0.0015. LEVER has a market capitalization of over $150 million, and it is ranked in the top 300 cryptocurrencies by market capitalization.
Next Events for Lever Coin
Here are some of the next events for Lever Coin:
LeverFi V2 Launch: LeverFi V2 is a major update to the LeverFi protocol that will introduce new features such as perpetual contracts and cross-margin trading. The LeverFi V2 launch is expected to take place in Q4 2023.
LEVER Staking Rewards: LeverFi plans to introduce staking rewards for LEVER holders in Q4 2023. This will incentivize users to hold LEVER and to participate in the governance of the LeverFi protocol.
LEVER Listings on New Exchanges: LeverFi is currently listed on a number of major exchanges, including Binance, KuCoin, and Gate.io. LeverFi is working to get listed on even more exchanges in the coming months.
Overall, Lever Coin has a number of positive fundamentals, including a strong team, a unique product, and a growing community. The upcoming LeverFi V2 launch and the introduction of staking rewards are likely to drive further demand for LEVER.
Disclaimer: I am not a financial advisor, and this is not financial advice. Please do your own research before investing in any cryptocurrency

Lever Rally Mode: Your Chance to Buy and Prosper!"Welcome to our crypto exploration hub! We're here to navigate the exciting world of digital assets, providing you with comprehensive insights into market dynamics and potential trading opportunities.Our mission is to decode the crypto market's mysteries and equip you with the knowledge you need to make informed investment choices. From the latest developments in Bitcoin to the hidden potential of various altcoins, we're your trusted source for daily technical analysis.While technical analysis is a valuable tool, it's important to remember that it's just one piece of the puzzle. We encourage you to take a well-rounded approach to your investments, considering factors like macroeconomic trends, news, and community sentiment.Join us for the freshest analyses, and don't hesitate to join the conversation in the comments below. Keep in mind that our content is purely for educational purposes and should not be construed as financial advice. Always integrate it into your broader investment strategy."

Lever Ready Again??Here is My Study On Lever
Welcome to my channel! Here you'll find daily technical analysis ofthe latest trends in the crypto market. From Bitcoin to altcoins, I'lIl be sharing my insights and predictions to help you make informed decisions
about your investments. Follow me for the latest updates and join the conversation in the comments!
Crypto technical analysis uses past price history to predict future price. It's not a guarantee and shouldn't be relied on solely for investment decisions. Consider other factors such as market trends, economic strength and
information dissemination. Use with caution.
This Is Not A Finacial Advise

LEVERUSDTLEVERUSDT is in strong bullish trend.
As the market is consistently printing new HHs and HLs.
currently the market has given the breakout from previous high, if the market sustains this breakout the next target could be 0.001680

LEVER/USDT Ready For Bullish Movement? LeverFi Analysis💎Yello Paradisers, need your attention! LEVER/USDT is currently maneuvering within a trading zone, laying the groundwork for a likely bullish surge.
💎A handful of days ago, it skillfully engaged with a bearish Order Block (OB), setting off on a downward path to tackle the bullish OB and secure buying liquidity.
💎If the price maintains its existing drive, it's set to aim for the supply zone above. However, let's not lose sight of the constant market fluctuations that could sway the price.
💎We're optimistic about the chances of the price revisiting the supply zone, given the residual liquidity.
💎Keep your charts updated and stay tuned for more insights! 🌴

✴️ LeverFi Will Be Hot (Easy 155% With 470% or 4.7X Potential) This pair will be hot, it is looking positive for massive growth in the days or weeks ahead. It looks like it is happening soon based on this chart.
LeverFi (LEVERUSDT) is trading within a long-term higher low based on candle/session close supported by high volume recently, really high.
The price is currently trading above EMA50 and starting to grow.
We can see the easy target on this chart being ~155%.
Additional upside is possible and almost certain after the bullish wave is confirmed.
We are going to err on the low side, as is usual.
The error will be in being too conservative.
The pairs we are sharing will grow much more than what we are pointing out in these charts.
I hope you are prepared.
Many warnings have been given.
The market gave us plenty of time...
It will soon move.
Namaste.

Long LeverLever is in a strong bullish trend, with the higher high on the Daily VWAP indicating a potential breakout. This could help Lever break through this resistance and reach my 1.618 Fibonacci target. With a 3:1 risk-to-reward ratio, it's too lucrative to pass up.
This chart based off of The Elliot Wave Theory, Fibonacci, EMA’s, MacD , RSI , Momentum, and resistance/support zones combined with patterns.

Lever detailed analysis #Lever on Big daily chart formed a falling wedge, broke it and retested it successfully which makes it Bullish for long term
But in 4hr chart, It's forming a triangle with red and green trendlines. It's not broken yet. If it breaks the green trendline then it will pump huge.
Also it's forming a head n shoulder pattern , it's breakout will happen when same green trendline will break.
Monday is usually red, means prices go down. So, for lever trade, timing is very important. For complete signals contact for VIP.

Lever Sell Trade Here Is My Study on Lever.
Welcome to my channel! Here you'll find daily technical analysis ofthe latest trends in the crypto market. From Bitcoin to altcoins, I'lIl be sharing my insights and predictions to help you make informed decisions
about your investments. Follow me for the latest updates and join the conversation in the comments!
Crypto technical analysis uses past price history to predict future price. It's not a guarantee and shouldn't be relied on solely for investment decisions. Consider other factors such as market trends, economic strength and
information dissemination. Use with caution.
This Is Not A Finacial Advise

LEVERUSDTRight now looking for scalp short off this Value area high for lever. Will trade it down to clear buyer onlys and onto that upwards impulse VAH- here i can open a hedge long. If we impulsively move below upwards impulse VAH and close HTF candle below, i will look for a backtest short.

$LEVER$LEVER
On Daily timeframe level the price action took out the Stop Hunts level at both Buy Side & Sell Side Liquities marked at .960 to .955 and .1778 to .1777
Marked out the FVG gap highlighted with RED BOX


Lever Buy Trade Here is My Study On Lever.
Welcome to my channel! Here you'll find daily technical analysis ofthe latest trends in the crypto market. From Bitcoin to altcoins, I'lIl be sharing my insights and predictions to help you make informed decisions
about your investments. Follow me for the latest updates and join the conversation in the comments!
Crypto technical analysis uses past price history to predict future price. It's not a guarantee and shouldn't be relied on solely for investment decisions. Consider other factors such as market trends, economic strength and
information dissemination. Use with caution.
This Is Not A Finacial Advise

LEVER could be the next BLZHello Traders,
LEVER might follow BLZ.
Reasons:
Breaking out with good volume
Double bottom
Low market cap (below $30 million)
Negative funding rate
Please hit the boost button and follow me for more ideas.
Thanks.

LEVERUSDT Title: Long-Term MovesIntroduction:
In this analysis, we will delve into the long-term movements of the LEVER USD in the spot market, using various technical indicators and market concepts. By examining the dynamics of bull and bear markets, understanding long and short positions, identifying support and resistance levels, and utilizing key indicators such as moving averages, RSI, EMA, Fibonacci levels, volume, breakout patterns, trendlines, and liquidity, we aim to gain valuable insights into the price action and potential future trends of LEVER USD.
1. Bull Market and Bear Market:
The market can be classified as either a bull market, characterized by rising prices and optimistic sentiment, or a bear market, marked by falling prices and pessimistic sentiment. Analyzing LEVER USD within the context of these market phases allows us to identify and capitalize on potential opportunities.
2. Long Position and Short Position:
A long position refers to buying an asset with the expectation that its price will rise. On the other hand, a short position involves selling an asset with the anticipation that its price will decline. By understanding these positions, traders can align their strategies with the market direction.
3. Support and Resistance:
Support levels are price levels at which buying pressure typically exceeds selling pressure, preventing the price from declining further. Resistance levels, conversely, are price levels at which selling pressure typically exceeds buying pressure, halting upward price movement. Identifying these levels is crucial for gauging potential reversals or continuations in LEVER USD's price action.
4. Moving Averages (MA):
Moving averages are widely used technical indicators that smooth out price data over a specified period. They help identify trends and potential areas of support or resistance. By analyzing different timeframes of moving averages, we can gain insights into LEVER USD's long-term price trends.
5. RSI (Relative Strength Index):
The RSI is a momentum oscillator that measures the speed and change of price movements. It helps identify overbought and oversold conditions, enabling traders to anticipate potential reversals or continuations in LEVER USD's price trajectory.
6. EMA (Exponential Moving Average):
EMA is a type of moving average that places more weight on recent price data, making it more responsive to current market conditions. By incorporating EMA into our analysis, we can obtain a clearer picture of LEVER USD's short-term price dynamics.
7. Fibonacci Levels and Fibonacci Retracement:
Fibonacci levels are horizontal lines drawn on a price chart to identify potential support and resistance levels based on Fibonacci ratios. Fibonacci retracement, a commonly used technique, helps identify potential reversal levels after a significant price move. By applying these concepts, we can identify key levels that may influence LEVER USD's price action.
8. Volume and Volume Profile:
Volume represents the number of shares or contracts traded during a given period. Analyzing volume provides insights into the strength of market moves. Volume profile, on the other hand, displays the volume traded at specific price levels, aiding in identifying areas of high liquidity and potential price reversals.
9. Breakout:
A breakout occurs when the price moves above a resistance level or below a support level, indicating a potential shift in market sentiment. Identifying breakout patterns in LEVER USD can provide valuable trading opportunities.
10. Higher Highs and Higher Lows:
Higher highs and higher lows are characteristics of an uptrend, indicating a series of price advances and pullbacks. By observing these patterns in LEVER USD's price movements, we can confirm the presence of an upward trend.
11. Trendline:
Trendlines are lines drawn on a price chart to connect consecutive highs or lows. They help identify the direction and strength of a trend. Utilizing trendlines allows us to assess LEVER USD's long-term trend and potential reversal points.
12. Support Level:
A support level is a price level at which an asset's decline is expected to halt, as demand for the asset increases. Identifying support levels in LEVER USD assists in setting appropriate stop-loss levels and determining potential entry points.
13. Volatility:
Volatility refers to the degree of price fluctuation in a given asset. Higher volatility may provide increased trading opportunities, but it also carries higher risks. Analyzing LEVER USD's volatility enables traders to adjust their strategies accordingly.
14. Liquidity:
Liquidity refers to the ease with which an asset can be bought or sold without significantly affecting its price. Assessing the liquidity of LEVER USD aids in executing trades efficiently and mitigating the impact of slippage.
Conclusion:
By analyzing LEVER USD's long-term movements through the lens of bull and bear markets, long and short positions, support and resistance levels, moving averages, RSI, EMA, Fibonacci levels, volume, breakout patterns, trendlines, support levels, volatility, and liquidity, traders can enhance their understanding of the market dynamics and potentially make more informed trading decisions. Remember to combine these indicators with other fundamental and technical analysis techniques for a comprehensive assessment of LEVER USD's spot market performance.

time to make profit on LEVERUSDThi every one
complete pullback to the trendline with 30% profit Potential
The information provided on this Page does not constitute investment advice, financial advice, trading advice, or any other sort of advice and you should not treat any of the website's content as such. this page does not recommend that any cryptocurrency should be bought, sold, or held by you. Do conduct your own due diligence and consult your financial advisor before making any investment decisio

LEVER COIN PRICE PREDICTION✅LEVER COIN PRICE PREDICTION✅
🔥 Price on the daily chart is forming a falling wedge and broke to the upside which is a Bullish Sign🔥
🚀🎯You can target around $0.002700 that's around 50% Gains🎯🚀
👉 Follow me for more opportunities.

lever usdtlever in a bearish pattern as well plus ma 50 aligning downwards is sign for downtrend
good luck not a reccomandation!

LeverFi (LEVER) formed Gartley for another price reversal moveHi dear friends, hope you are well, and welcome to the new update on LeverFi (LEVER) token with US Dollar pair.
Previously we caught almost 25% pump of LEVER as below:
Now on a 2-hr time frame, LEVER has formed a bullish Gartley move for the next price reversal move.
Note: Above idea is for educational purpose only. It is advised to diversify and strictly follow the stop loss, and don't get stuck with trade
