LINAUSDT trade ideas


LINA/USDT - Falling Wedge Breakout IncomingLINA/USDT - Falling Wedge Breakout Incoming? 🚀
Chart Description:
LINA/USDT is forming a falling wedge pattern on the 1-hour timeframe, a bullish reversal signal. After a long consolidation period, we may soon see a breakout to the upside.
🔹 Key Levels:
Entry Zone: Near current levels
Target 🎯: 0.00797
Stop Loss: 0.00607
With a solid Risk/Reward ratio, this trade offers a promising setup. Keep an eye on the breakout and retest for confirmation. 📈
⚠️ This is not financial advice. Please do your own research before making any trading decisions.
Do you think LINA will hit the target? Drop your thoughts below! 💬🔥
#LINAUSDT #CryptoTrading #ChartAnalysis 🚀


LINAUSDTPA breakdown of BTC to scoop liquidity in the 18400s, and possibly fill the wick it left behind from the CPI frenzy last week, could see Lina plunging to do a RTO on 12hr. If that happens, I expect a couple of supply zones on 4hr and 6hr to get mitigated as we run into the American midterms. Even likely, a double tom scenario at 0.0096.


LINA-USDT chartLINA-USDT pair broke a monthly downtrend and holding range.
Most likely the drive is the recent developments by the team, but also the election in the US.
Short term on 1 hourly chart its ranging and retesting.
on daily chart i expect it to push up to the next line of resistance at 00,055-00,10.
This is a smallcap so doing a 80% is not uncommon.
Don’t get shaken out by lowertimeframe bullshit.

Trade Signal for LINAUSDT: Direction - SellDear Traders,
We have identified a potential trading opportunity in the LINAUSDT pair using our EASY Quantum Ai strategy. Based on the latest market analysis and algorithmic calculations, we recommend the following trade setup:
Direction: Sell
Enter Price: 0.004134
Take Profit: 0.004049
Stop Loss: 0.004228
Our forecast suggests a downward movement in the LINAUSDT pair, predicated on the following factors:
1. Technical Indicators: The analysis shows a bearish divergence in key technical indicators suggesting potential downside momentum. The Relative Strength Index (RSI) has reached overbought levels, increasing the likelihood of a trend reversal.
2. Market Sentiment: Current market sentiment indicates a growing bearish outlook among traders, supported by recent trading volumes.
3. Resistance Levels: The pair encountered strong resistance near the 0.004228 mark, further validating a potential downward move.
This signal is specifically curated by our EASY Quantum Ai strategy, leveraging advanced data analysis to optimize your trading decisions. Please consider your risk management strategies and adjust positions accordingly.
Happy Trading!

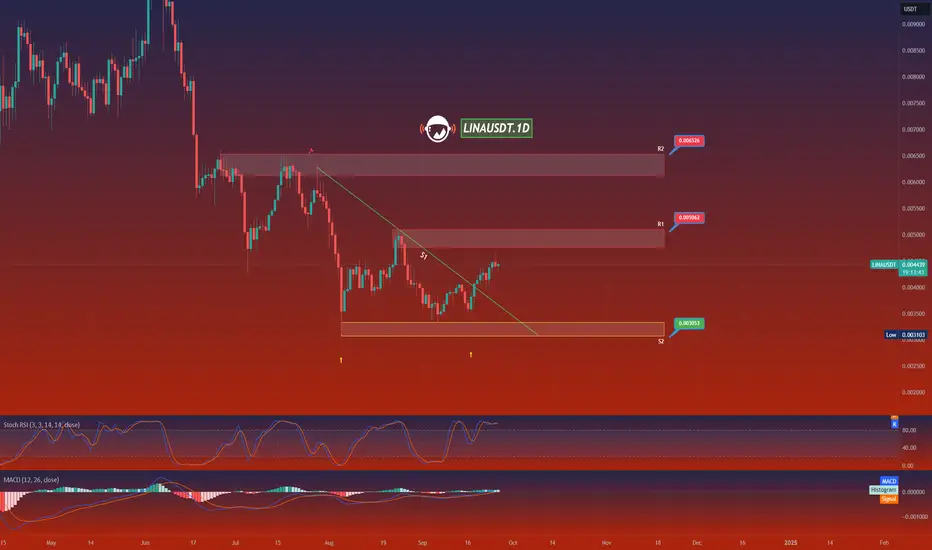
LINAUSDT.1DIn the technical analysis chart provided for LINA/USDT on TradingView, we observe a detailed representation of Linear's price movement against the US Dollar Tether on a daily timeframe. The chart identifies two key resistance levels (R1 at $0.005062 and R2 at $0.005626) and two support levels (S1 at $0.003053 and S2 significantly lower, near the lowest visible range of the chart).
The price action shows that LINA has experienced a significant downtrend from earlier peaks, stabilizing into a consolidation phase around S1. Recently, the price seems to have broken this consolidation phase with a slight upward movement towards R1. This suggests a potential shift in market sentiment from bearish to cautiously bullish, as the market tries to reclaim higher levels.
The presence of support and resistance levels provides a clear framework for potential trade setups. If the price sustains above the S1 level and breaks through the R1 resistance, it may attempt to reach R2. This would indicate increasing buyer momentum and could present a buying opportunity. However, if the price fails to break R1 and retraces back towards S1, it could reaffirm the existing bearish sentiment, suggesting a watch-and-wait approach for a potential sell on a downtrend resumption.
For trading strategy, I would focus on the response of the price at these key levels. A break and hold above R1 can be seen as a bullish signal, potentially leading to trades targeting R2, with stops below R1 to manage risk. Conversely, a failure at R1 and a subsequent fall below S1 could trigger bearish trades, targeting lower support levels, ensuring stops are placed just above the breakdown point to limit potential losses.
In conclusion, while the chart presents an opportunity for both bullish and bearish scenarios, closely monitoring price action at these pivotal levels will be crucial. Traders should also consider broader market sentiment and news that may impact the price dynamics of LINA. As always, employing a disciplined risk management strategy will be key to navigating the potential volatility in this market effectively.
LINA Analysis (4H)It looks like a bullish pattern has formed from where we placed the green arrow on the chart.
So far, by the data available from this pattern, it appears to be a triangle.
Wave D is over and price is forming wave E.
It is expected to move towards the red range while maintaining the green range.
Closing a daily candle below the invalidation level will violate the analysis.
For risk management, please don't forget stop loss and capital management
Comment if you have any questions
Thank You


bottom must be confirmed at $0.003-$0.004It has been in consolidating zone for more than 2 years. And product development team is also doing a great work. But If it respects this bottom around $0.003-$0.004, this also suggests there is a high chance it can make a strong reversal from $0.003 area to $3-5$ range in an upcoming bull run


LINA looks bearishFrom where we put the red arrow on the chart, it looks like LINA is forming an ABC now that wave B is over and we are in the middle of wave C.
We are looking for sell/short positions in the supply range.
Closing a daily candle above the invalidation level will violate the analysis
For risk management, please don't forget stop loss and capital management
Comment if you have any questions
Thank You

