NUMBER ONLY GO UP NOW - THE BOTTOM 09/12/2020LINK/BTC just finished it's last dip ever and the same with many other ALT/BTC charts.
The bottom was 9th December 2020 and you can quote that in a months time and call me a king and ask me what kind of crystal ball I have.
LINKBTC trade ideas


textbook wyckoff accumulation. i believe we are in a textbook accumulation. the last few times was chainlink the front running altcoin. i think this is in the cards again. there is a very clear pattern as you can see.
also the market tends to "test" the previous all time highs. so there should be a lot of orders hanging in that area.
the trading range is between 0,00067 and 0,00087. as you can see it tested this range several times. this is for the big players to test if theres a lot of sellers in the market. the test below is also to see if there is demand for chainlink. sometimes this patterns goes with a very aggressive spring or shakeout. this is the last test and to shake off all the weak players in the market. it also would touch a lot of stop-losses. i think the level for a spring should be at least 0,00056. the last 3 bullcycles it touched the ath also. and a 15% procent dump is for a altcoin not that much. this would be the perfect buy opportunity in my opinion.
if there is no spring we have to look at volume, so we get an change in character. if we overcome the equilibirium at the approx 0.00076 level, i would consider to buy some chainlink.
possible target for the coming future is the breakout of the 0,00087, and the previous all time high at 0,0016.


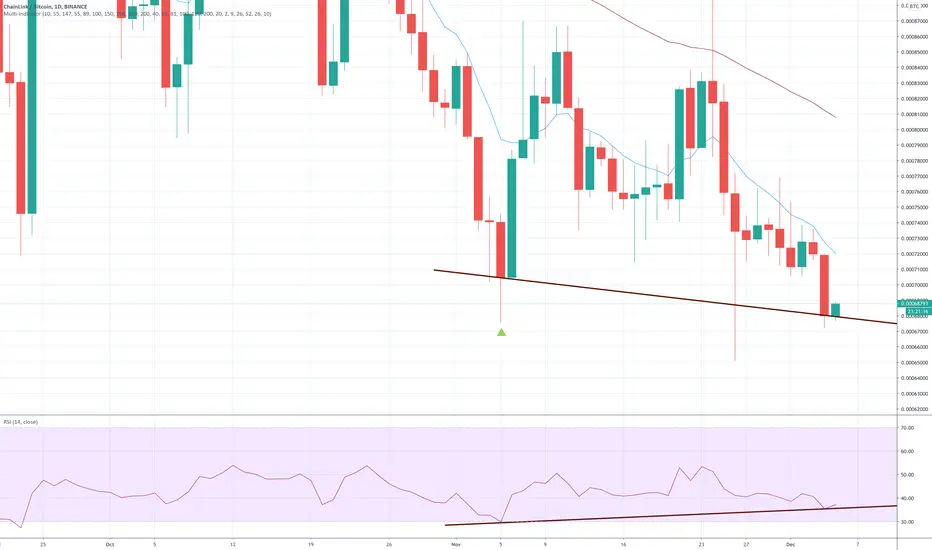
LINKBTC - Game Over for LINK ? Breaking down critical support!- Link is turning bearish on the weekly time frame, i would sell LINK
- This trend line established in 2019 is breaking down
- Head and Shoulder bearish reversal pattern (H & S)
- RSI trend line is also breaking down on the weekly time frame
- The price is below 20 moving average and below 2 important trend lines
If you want more of these ideas, hit the like button and follow me, so you don't miss any update!
Also, check my signature down below ↓

LINK.BTC (Y20.P5.E1).Stalking this levelHi All,
This post intention is like the previous post I did with ETH BTC pairing, to work out when will it be time to flip to the ALTs.
By getting a few samples, one should be able to ascertain how close we are to that scenario, while BTC ranges between high 18K to high 19k.
And just like the previous ALT season, towards the end of BTC final big move, the ALTs pretty much hit their targets and if I recollect, BTC dropped from 12 K to 10 K.
Not surprising because when we flip to the ALTs, it takes volume and momentum away from BTC.
Its possible we will have this repeat.
For now, looking at the weekly LINK BTC pairing chart, with log settings turned off, we can see the price is approaching the 0.618 retracement or the 0.318 fib level.
I have confidence there will be a bullish divergence in the making on the weekly and the Phoeix indicator is showing this.
As for the other indicators, we have the histogram on the MACD and we have the Stochastic hitting bottom, all showing signs that the fib level could be it.
Is it time now, no!,,, Is it time to start accumulating from some of those dips.... I think so. I know I am.
On the 3 Day chart, we can see bullish div. with the MACD.
We can also see the Red RSI on the Phoeix starting to curve upwards.
All the best,
S.SAri

LINKBTC - Old chart I drew weeks ago - where are we now?This is an old LINK chart that I drew weeks ago:
* Targeting the purple line as a decision point for the current trend
* Price has largely followed the direction I anticipated so far, still targeting this level
* Once it reaches this level I'd be looking at getting in with a tight stop.
LINK is not to be underestimated. When the normies enter the market this has word of mouth, rabid community (that idiot crypto friend in the office), tenure and also a bit of DeFi gold dust. And, you can buy it fairly easily.
An obvious DeFi 'major' to build a position in for 2021. DCA in to get a decent average buy price.

Linkers it's time to riseSave this line
Sergey stop selling
I'm buying
Why there is so much 6 ?
do it or Die

LINKBTC lose not hopeTodays BTC push puts a dent in Alts and they underperformed. Hopefully BTC will stabilize and give room for Alts to breath. Currently LINKBTC is in a symmetrical triangle with a 4H bullish divergence if a bounce is established. 12H ichimoku shows a twist.

LINKBTC - this is the make or break momentWill history repeat itself? Will chainlink continue to grow exponentially to bitcoin in the coming months?
Impossible to say.
Chainlink was introduced at the very end of the last bull market - we never got to see it truly perform in the last cycle.
However, as we've seen, LINK has grown exponentially to BTC during the latest bear market - increasing an absurd 12,000%+ from the Dec '17 low to the DeFi bubble high this past August '20.
Trends are our friends, until they end. And this trend is about to be tested.
The current price action from the peak of Aug '20 to Dec '20 looks eerily similar to what we saw in the summer of 2019. Almost the same % gains and losses from troughs, to peaks, and back to potentially the next trough.
Obviously, this depends a lot on what bitcoin does. I posted recently about BTC, which you can check out here:
Would love to hear what you guys think!
Good luck


Link have a daily bullish divergence against bitcoin.Link, this is your moment.
I hope we will have a nice weekend.


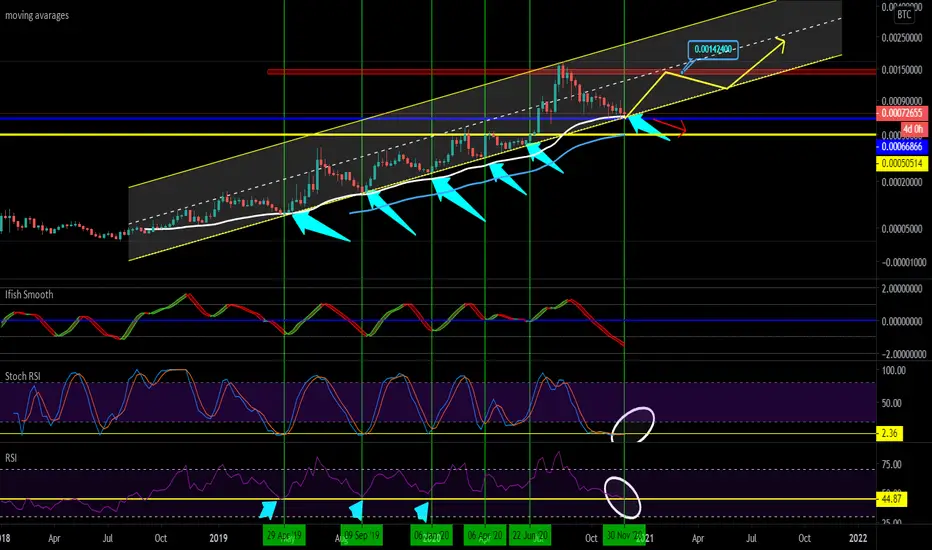
Chainlink getting very intersting again LINKBTC getting very interesting again.
You may ask why key point! 😊
- Chainlink has been bouncing on 50 Weekly MA ever Since April 29, 2019
- Trendline intact from 29 April 2019 until now every time we get a big run. Price always
Tend to come back and test the trend line.
- July 30 2018 ChainLink Bullrun started and RSI weekly never been below 44.87 every time it came down and touch look what happens with the price.
- We have TD Sequential count on sell 7 so coming 3 weeks should be very interesting
- Stouch RSI about to flip Positive.. on weekly which is big deal. Everytime Stoch touch 2.36 point look what happen next to the price.
Scenario 1:
Price keeps the bull trend and we continue with uptrend which I also expect.
So I would recommend buying below 0,0072 sat and hold Target on the chart.
If u wanna play safe wait for positive flip on stoch RSI weekly, Ifish smooth flip green and RSI bounce.
Scenario 2:
Price break the trend and close below 50MA weekly ur next buy target would 0,00050k sat which is 200 weekly MA
And exit target would be 0,00070k area. Break above 0.00070k sat again = back to bull mode!! rejection would lead long bear market. Highly unlikely scenario
Chainlink is a must holdLINKBTC has been bleeding for 4 months after a massive rally. We are back at our support line and I think that in december/January LINK will come back as this is a time period where ETH usually pumps.


Bitcoin, XRP, & Link Technical AnalysisBitcoin bulls have another shot at breaking $20,000 however seemingly lack the momentum. We look at some key levels should they fail, price target if they succeed and what this means for two cryptocurrencies I'm watching XRP & Link for potential trades
Like the video - it would be really appreciated
Comment what you would like covered next below


LINKBTC not so bullish target 0.000052Bear flag, rising wedge , retest of triangle's break down. Does not look bullish to me. Measured move of the bear flag is 0.000052. Invalidated if it goes back in the triangle.

LINKBTC road to All-Time HighBased on historical data, LINKBTC is performing inversely proportional from BTC.D. and LINKBTC keeps on making All-time Highs within a span of 120 days which starts from Dec 1. So, where do you think we are heading now? Pack your bags up and prepare for take off. BINANCE:LINKBTC
