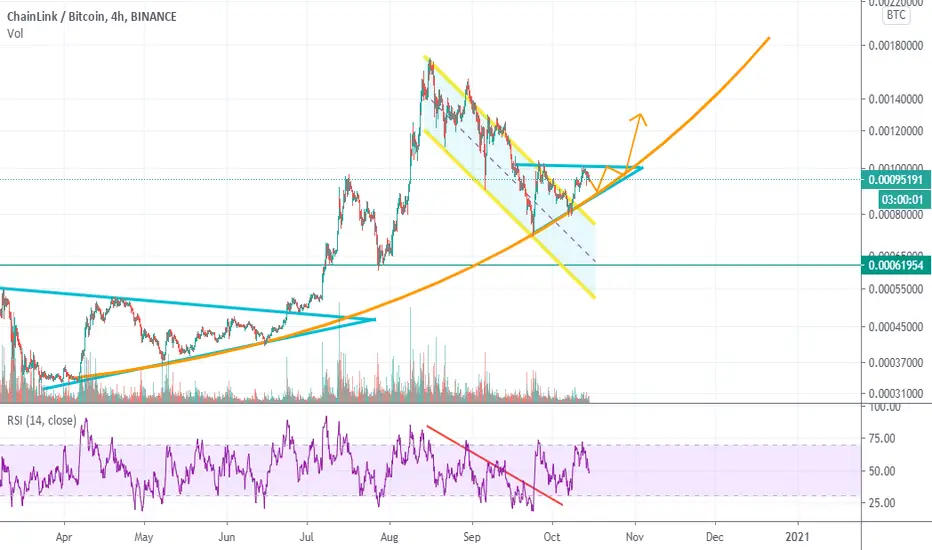
LINKBTC in an ascending triangleDon't believe the FUD, alts season is coming back and link will continue on its parabolic run. We may see a couple of weeks of weakness in Alts as BTC pullsback.
LINKBTC trade ideas
LINKBTCA buying opportunity, not a recommendation
Buy from the orange line, the red line, the stop loss
Targets are shown in green
Do not enter the deal with more than 5% of your account
good luck for everybody

Possible ABCD to major trend // short term tradepossible opportunity to buy
target ABCD
stop under golden zone area

LINK walking up the trend nicely I noticed the Adam and Eve Double bottom on LINK today.
so I am Keeping an eye on the small up trend here.
a close above previous structure could see a nice 21% move which would make the Adam and eve Double bottom valid
always consider what direction BTC is going when trading alts
LINKBTC
4hr
"DISCLAIMER: NO ADVICE. The information presented here is general in nature and is for education purposes only. Nothing should be considered to be advice. You should consult with an appropriate professional for specific advice tailored to your situation."

LINKBTC_DailyPrice: 0.00094
Entry: 0.00094
TP_LVL II: 0.0011
Tp_LVL III: 0.00132
SL: 0.000746
Expected Return: 40.43%
Risk/Reward: 0.5


Chain Link bottom out?Looks like Adam and Eve pattern forming right at breakout of downtrend showing a double bottom at the MMA200. Looks pretty bullish to me. Heavy resistance near .0013 BTC


CHAINLINK BUY AND SELL ZONES!!So everyone knows about chainlink buy now unless your living under a rock, but if so thats ok, heres some quick and easy buy and sell zones to keep an eye on.
everytime the RSI is over sold it tends to be a great buy time or DCA (dollar cost averaging) in. also around the bottoms before next run MACD seems to be a little laggy but histogram is right on.
The same goes for the over bought on the RSI tends to be a great time to sell. be good time to probaby scoop up a little on this now if you wanted. it wouldnt hurt.

$LINK / $BTC Update from previous chart - now looking very Bullish (but what if $BTC fakes out and dumps.......... tbc)

Picking up $LINK on TD9 buy signal. I put my bid in two days ago in anticipation of LINK hitting this previous TD9 buy signal from September 22. I'm targeting a stop below the July support level, and am aiming my exit for a new ATH. I am extremely bullish on LINK, having gotten in on the ICO. I have not moved my tokens until a few weeks ago when I converted half of my funds to the Yearn yaLINK vault. This is a much smaller position, sized according to Elder's 2% rule.
I'll be looking to move my stop as we approach the Aug 8 TD Sell signal for capital preservation and a no-risk trade.


$LINK / $BTC Warning to all you $LINK fans, watch out for this breakdown in price if support does not hold!

LINKBTC - Critical ZoneNow..
We came very close to the resistance line of descending channel.
Until a few hours ago, the uptrend scenario was more likely to happen. But now the situation is different
We are waiting to see what happens to react appropriately.


LINK/BTC: Imminent Breakout Analysis - 1D, 1HIn this post, I'll be providing an analysis on Chainlink (LINK), shedding light on its daily and hourly chart through technical analysis.
Daily Chart Analysis
- To begin with, the daily chart is on the left, and the hourly on the right
- The daily chart demonstrates that prices are trading within a descending channel, forming lower highs and lower lows
- The Relative Strength Index (RSI) is at neutral levels, showing signs of a potential breakout
- The Moving Average Convergence Divergence (MACD) is forming a potential death cross, but has not provided confirmation yet
- We can interpret the current setup as a consolidation phase of a bullish flag pattern
- Should we see prices break through the upper channel resistance, we could potentially expect another leg up to 0.002btc
Hourly Chart Analysis
- Zooming in on the hourly, we see clearer signs of bullishness
- Prices are forming an ascending triangle pattern, in which the tops of the pattern are rejected at 0.000894 btc levels, while higher lows are formed
- The RSI is also in an uptrend, forming higher lows as a sign of momentum building up
- Based on the ascending triangle pattern, we can count Elliott triangle waves (ABCDE)
- This wave count shows that a breakout through the triangle pattern is very imminent
- The 100 Simple Moving Average (SMA) on the hourly chart is a good reference of support/resistance zones.
You can check out my other analysis on Waves (WAVES) which had a very similar setup: an ascending triangle within a descending parallel channel.
Conclusion
Chainlink seems like it's headed to retest previous highs as indicators and bullish pattern setups demonstrate potentiality for a breakout.
However as always, don't predict the market. Take it by levels, and play by probabilities.
If you like this analysis, please make sure to like the post, and follow for more quality content!
I would also appreciate it if you could leave a comment below with some original insight.


Link still room for move downOne leg still missing for drop to be completed. Next week potentially as dollar index is still looking strong.

LINKBTC| 44% Profit in less than 20 daysBINANCE:LINKBTC might move upward after hitting the support level. If the price showed an upward trend there might be a really good opportunity to go long and place our TP at the nearest resistance level.
Entry price : 0.00087
Take Profit : 0.00125
.
.
.
.
What do you think about this strategy, share your comments bellow;
Make sure to subscribe !
If you enjoyed this Idea hit the Like button and support us!
