It’s enough for now to $LINK VS #BitcoinSell after daily close under the entry
Your target is on the chart as well as your Stop loss
Good luck mate
LINKBTC trade ideas


Link-time to buyHello guys,
I have already started buying again.I know,daily seems to be absolutelly horibble but..common' its a LINK! :) .I believe in jump up sooner/later trendline should act as support if not,ready to buy more if prices are low.I am not using a leverage trades .Lets see
.
Thanks for comments

LINKBTC - 4H🙈 Locally watching a falling wedge. Price tested it successfully. I will try to enter long with the goals indicated on the chart

Link longLonging linkbtc chart here. Crossed diagonal well. Daily looks great too from the massive bull pattern following the pump earlier last month.

Long LINKBTCAfter another retrace of more than 40% link seems ready to take off again and resume its uptrend target 125k sats.

LinkLink levels to watch on the daily. Very close to a move here, whether falling below support or a bounce. It’s looking more like a bounce with the bull pattern.

LINK/BTCLink is actually sitting on the confluence of the last All-time-high, the Fib golden pocket level, and 100EMA. With BTC is ranging between 10930-11K1 and BTC.D dumping, its logical to bet on this setup which gives you around 3% stoploss under the green box.
On the lower timeframe, RSI is also rising from the oversold territory.
Note: If you like the content and the setup, please give me a follow not to miss out on many altcoins charts to come.

LinkBuy Link!, link is formed big symmetrical triangle/bullish pennant, and already bounce off the 0.618 golden pocket, breaking out from this triangle, can lead the price to new ATH
leave a comment if you wish to added into private telegram group.

$LINK, On high volatility with 20% daily candles$LINK
On high volatility with 20% daily candles
~120k/94k levels I'm watching as resistance/support..
UCTS is bearish on the daily and lower tfs // Ichi cloud matching support
BTC will have a great influence so unless you are already short wait for some consolidation
#LINK

$LINK - Following a bubble pattern - The sotory continuesA few weeks ago I had this feeling $LINK is following a typical bubble pattern. It was not believed, however it still is valid to me. We are at a crucial point however. Will $LINK manage to get back to the mean? And possibly cross the 200MA again? Interesting. For now I am just studying this chart before taking a position.

Turkish Baklava Pattern-The Time is Coming-LINK/BTCIt has found support, the possible leap will be very soon.

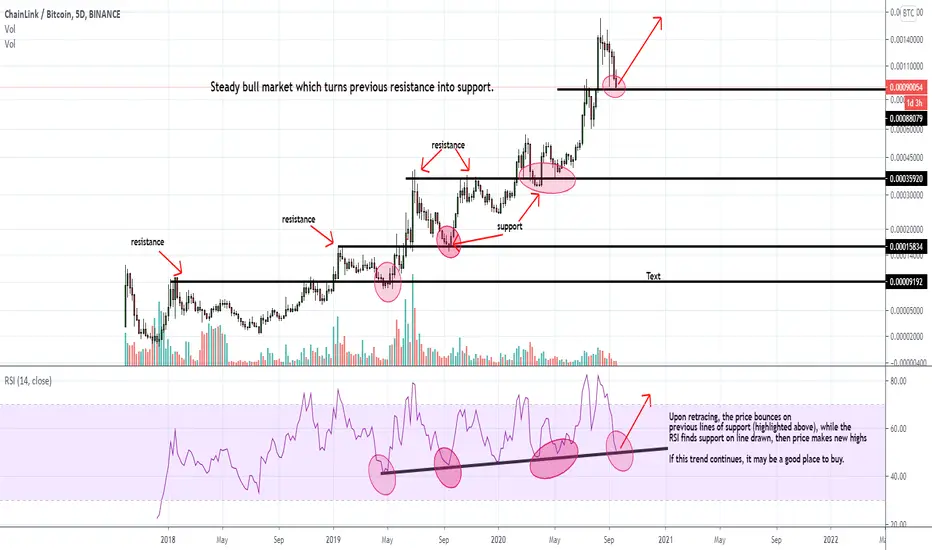
Chainlink ready for possible longterm bullrun, 3 scenariosThree entry points based on time and price, price was derived from horizontal support analysis, time was derived by diagonal trendline analisys
Upper longterm target is just a guess based on psychological significance, $LINK could very well reach 0.01 BTC instead of 0.005
This is a longterm analisys, for the time being the outlook is neutral

SHORT LINK and ATS efficiency report since July Hello!
This Summer Link has shown the best dynamics ever.
ATS's strategy has also shown perfect outcomes since the very beginning of July, giving correct indication of the trend changes.
ATS has performed 175% in 6 trades
Link has become more expensive by 146%
It is better to trade correctly instead buy and hold.
The link is currently still moving in the downtrend channel.
We think there will be good selling opportunities soon, chances are high that the first level of support will be tested.
Script settings for 4H timeframe:
· Signal calculation type - "ohlc4"
- Signals filter - "Enabled"

Chainlink retest of precious resistance?My guess at where this correction will end is the previous resistance line.

Giant bullish pennant flag Huge Pennant flag on the daily. Link has been trending down lately while most alts have moved up, looks like a big move coming.

Bitcoin, Gold, Ethereum, and ChainlinkDespite the rally today we are at a key inflection point where the crypto assets have found resistance at the 20Day moving average which is sloping down bearishly and all awaiting the natural wave 3 of the correction. Corrections rarely complete in 2 swings and I think we are awaiting the third leg down in #Bitcoin, and #Ethereum. However, #Chainlink appears to have completed 3 waves and is now consolidating. Gold is actually looking a bit more bullish today as the DXY (US Dollar lost strength and precious metals bit back a bit.
#cryptocurrencies #bitcoin #chainlink #btc #eth #crypto #coinbase #currency #binance #link #trading #forex #technicalanalysis #gold #markets #dmi #indices #stocks #stockmarket #investing #preciousmetals #investors #economics #capitalmarkets #ether #fib #business #fintech #news #marketing #money #branding #digital #smallbusiness #content #like #education #technology

4 hours frame for linkbtc and current trendportion of the big weekly chart that was published earlier


Bitcoin and Crypto 12/09/2020#Bitcoin Monthly Chart - Chaikin Money Flow working wonders as an indicator on all time frames above the daily chart.
#BTC Daily #DMI - looking at the #ADX and the #DI assessing the strength and variance of the trend.
#Bitcoin 8 hour chart Good Bollinger band support now and Fib 236 still resistance.
#Ethereum Daily Chart -
#Fib retracement 382 Resistance at $377 buy signal if closes above $377 Above 50 day.
SMA strong support last two days.
#Eth - eth/btc daily chart.
Interesting the 50 day moving average has held strong support ever since the pull back on 5th September.
#Ether has also got above the middle bollinger band and held strong support in the last three days.
Currently trading at 35,773.. Above 35,914, the 050 fib I am bullish on eth/btc
In #ChainLink on the 3 day chart, the fibonacci retracement level 050 held strong support at $10.49 ...Now the fib 382 is strong resistance at $12.55. Any close above that bullish on Link.
#link/usd 4 hour chart fib retrace 236 strong support now 382 at $13.16 being tested. The bullish divergence I show here never gave link the pump I anticipated!
Similar on link/btc the 236 support and 382 resistance is the channel link is stuck in.
The breakout is a close over 126,999 sats
