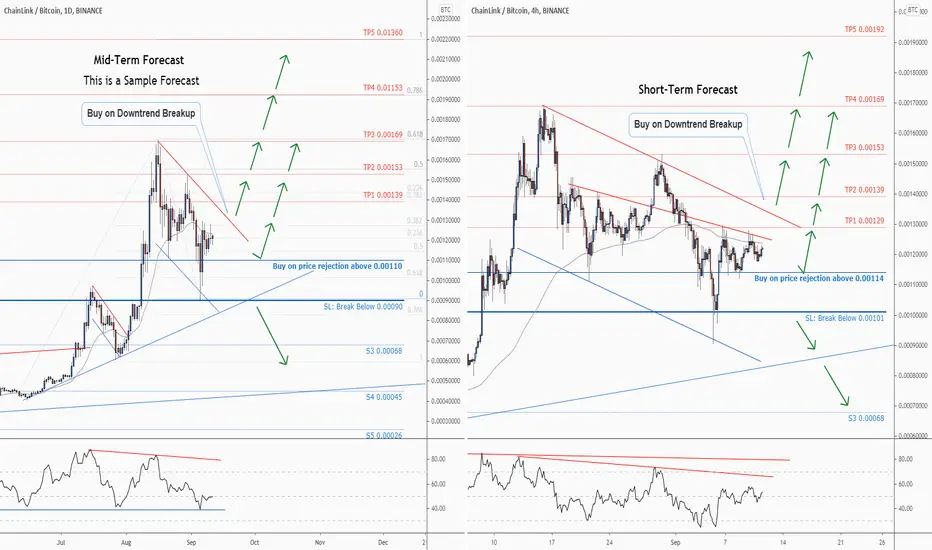
Two buy opportunities on this chart for LINKBTCMid-Term Forecast
Trading suggestion:
". There is a possibility of temporary retracement to suggested support line (0.00110).
. if so, traders can set orders based on Price Action and expect to reach short-term targets."
Technical analysis:
. LINKBTC is in a range bound and the beginning of uptrend is expected.
. The price is below the 21-Day WEMA which acts as a dynamic resistance.
. The RSI is at 50.
Take Profits:
TP1= @ 0.00139
TP2= @ 0.00153
TP3= @ 0.00169
TP4= @ 0.01153
TP5= @ 0.01360
SL= Break below S2
---------------------------------------------------------------------------------------------------------------
Short-Term Forecast
Trading suggestion:
". There is a possibility of temporary retracement to suggested support line (0.00114).
. if so, traders can set orders based on Price Action and expect to reach short-term targets."
Technical analysis:
. LINKBTC is in a range bound and the beginning of uptrend is expected.
. The price is below the 21-Day WEMA which acts as a dynamic resistance.
. The RSI is at 52.
Take Profits:
TP1= @ 0.00129
TP2= @ 0.00139
TP3= @ 0.00153
TP4= @ 0.00169
TP5= @ 0.00192
SL= Break below S2
❤️ If you find this helpful and want more FREE forecasts in TradingView
. . . . . Please show your support back,
. . . . . . . . Hit the 👍 LIKE button,
. . . . . . . . . . Drop some feedback below in the comment!
❤️ Your Support is very much 🙏 appreciated! ❤️
💎 Want us to help you become a better Forex trader ?
Now, It's your turn !
Be sure to leave a comment let us know how you see this opportunity and forecast.
Trade well, ❤️
ForecastCity English Support Team ❤️
LINKBTC trade ideas
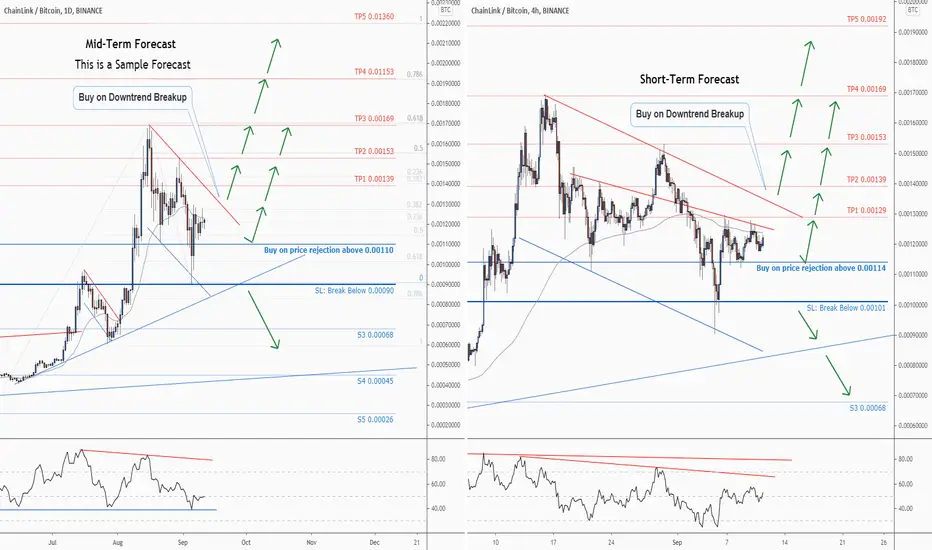
Two buy opportunities on this chart for LINKBTCMid-Term Forecast
Trading suggestion:
". There is a possibility of temporary retracement to suggested support line (0.00110).
. if so, traders can set orders based on Price Action and expect to reach short-term targets."
Technical analysis:
. LINKBTC is in a range bound and the beginning of uptrend is expected.
. The price is below the 21-Day WEMA which acts as a dynamic resistance.
. The RSI is at 50.
Take Profits:
TP1= @ 0.00139
TP2= @ 0.00153
TP3= @ 0.00169
TP4= @ 0.01153
TP5= @ 0.01360
SL= Break below S2
---------------------------------------------------------------------------------------------------------------
Short-Term Forecast
Trading suggestion:
". There is a possibility of temporary retracement to suggested support line (0.00114).
. if so, traders can set orders based on Price Action and expect to reach short-term targets."
Technical analysis:
. LINKBTC is in a range bound and the beginning of uptrend is expected.
. The price is below the 21-Day WEMA which acts as a dynamic resistance.
. The RSI is at 52.
Take Profits:
TP1= @ 0.00129
TP2= @ 0.00139
TP3= @ 0.00153
TP4= @ 0.00169
TP5= @ 0.00192
SL= Break below S2
❤️ If you find this helpful and want more FREE forecasts in TradingView
. . . . . Please show your support back,
. . . . . . . . Hit the 👍 LIKE button,
. . . . . . . . . . Drop some feedback below in the comment!
❤️ Your Support is very much 🙏 appreciated! ❤️
💎 Want us to help you become a better Forex trader ?
Now, It's your turn !
Be sure to leave a comment let us know how you see this opportunity and forecast.
Trade well, ❤️
ForecastCity English Support Team ❤️
LINKBTC H4: Strong chart / 18% gains possible / BUY DIPS(SL/TP)(Why get subbed to to me on Tradingview?
-TOP author on TradingView
-15+ years experience in markets
-Professional chart break downs
-Premiun content
-not just random lines on the chart
-Supply/Demand Zones
-TD9 counts / combo review
-Key S/R levels
-No junk on my charts
-Frequent updates
-Covering FX/crypto/US stocks
-24/7 uptime so constant updates
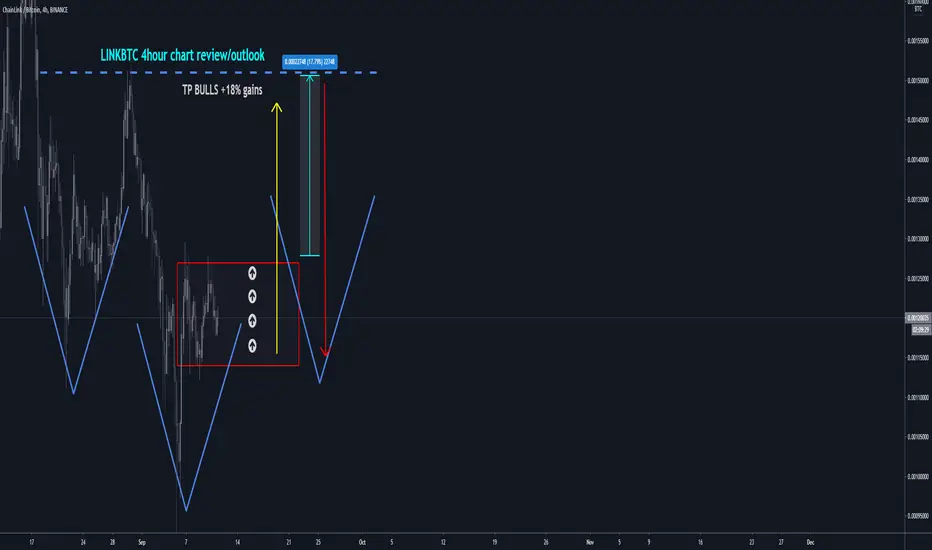
LINKBTC H4: Strong chart / 18% gains possible / BUY DIPS(SL/TP)(NEW)
IMPORTANT NOTE: speculative setup. do your own
due dill. use STOP LOSS. don't overleverage.
🔸 Summary and potential trade setup
::: LINKBTC 4hours/candle chart review/outlook
::: overall strong chart, coming from
::: previous accumulation in range
::: expecting breakout soon
::: 18% upside possible from here
::: buying mild dips makes sense now
::: chart may transition into bullish IHS
::: let's take it one step at a time though
::: recommended strategy: MARKET BUY
::: TP Bulls is 18% gains TP 15100
::: BUY/HOLD setup / swing tarde
::: for patient traders only / no fast gains here
::: re-test of 15100 required now to complete
::: the sequence for the BULLS
::: Just buy low and you will get paid, period
::: good luck traders
🔸 Supply/Demand Zones
::: N/A
::: N/A
🔸 Other noteworthy technicals/fundies
::: TD9/Combo update: N/A
::: Sentiment mid-term: BULLS/SWING
::: Sentiment outlook short-term: NEUTRAL/RANGE
LINK after DeFi crash2020 hyper coin Link has its first significant correction.
What changed after a DeFI crash? Well, to be honest nothing has changed. People are still loving Link and generally it is still one of the most popular investemen assets in 2020.
So sentiment is okay, people are looking what Bitcoin's next moves will be. And from TA, as it shows on a chart. Bitcoin could rally a bit so the Link could re-test a support, and after BTC will settle a bit,
we can expect Link to break that local resistance any skyrocket to the next one.
Regards

Pamp it sirs. Breakout confirmed.130k sat resistance incoming.
Will post an update then.
Pump it kind sirs!

LINK/BTC is going to fall!LINK/BTC spiked from the Resistance/Support as was predicted. The price was rejected by 0.618 fib Resistance together with ROT swing.Bearish Engulfing in summary suggest that the price is going to decline.
If you like the idea PLEASE don't forget to hit the LIKE 👍👍👍button
Also share your thoughts and charts here in the comment ⌨️ section!
Appreciate your time and good luck!😉

LINK.BTC (Y20.P4.E3).TA on the Macro structureHi All,
Based on the RSI and MACD formations, in my opinion, the following is likely to happen against BTC.
As for BTC I see a short term bounce to 10600 which aligns with this.
Note: AB=CD played out perfectly in both BTC and USDT charts.
LINK.BTC 2 HRLY chart
==================================================
4 HRLY chart:
==================================================
DAILY chart
==================================================
Looking for the MACD to cross over however its a slow indicator.
LINK.USDT
Please give me a like or tick for this effort.
Cheers,
S.Sari

Last 7 linkbtc corrections are around 40%Or .26 of the advance. The average up is about 160%-200% and the average correction is 40%-50%


LINK.BTC (Y20.P4.E2).Fractal and compound strategyHi All,
It is times like this (things are bullish), I search for opportunities. That 5% here and there can be compounded to make much more gains down the track.
I tend to use the total BTC equivalent as a measure to how I'm trading, especially in an uptrend. Down trend, I tend to look at the USD value to ensure I'm limiting my losses.
Anyway, here is one of those opportunities I have already acted upon.
Late last night, I flipped 1/2 of my LINK to BTC as I saw bearish signs at the micro level.
I will use the same BTC to buy back when I feel the time is right. Hence I will have more LINK and based on this chart, more BTC equivalent.
As for the 4 hrly chart, we can observe the following:
> the indicators support the fractal, from the 21\34 ema, fib level and formation\structure;
> the macd fractal will confirm it, and using the KDJ, will get an earlier signal as the MACD is lagging more so;
Link structure overview: Parabolic structure in tact and using fibs, target levels are clear
Close up view
Daily chart, candle sticks are weaker so far in this fractal area
Please give me a like or tick for this post
Regards,
S.Sari

Reversal - ChainlinJust my thoughts. Possible IH&S? Or just pure optimism :)
What are your thoughts?


LINKBTC price actionBINANCE:LINKBTC is showing positive price action bouncing back from buy zone shown in green and from the bottom of the channel. I would prefer to see bullish divergence on the RSI similar to the bearish divergence formed at the two previous tops, hence, there is high probability that we will visit support at 0.00097
Hit the like button please if you find this useful :)
This is only my own view and not a financial advice, do your own analysis before buying or selling
Happy Trading!


Link to bounce from the FIB 0.236!Link seems to show some signs of the possible bounce. The pair lies in the oversold RSI area and analysing the past uptrend we also see the Support that could be established at 0.236 FIB LVL , so the rise is highly likely scenario.
If you like the idea PLEASE don't forget to hit the LIKE 👍👍👍button
Also share your thoughts and charts here in the comment ⌨️ section!
Appreciate your time and good luck!😉


LINKBTC - Long - Potential 17.84%LINKBTC - Long - Potential 17.84%
Entry - 118691
TP1 - 130190
TP2- 139811
SL- 107822
Please comment with thoughts and how you get on.
If you like the idea, then hit like on the idea & support with a follow.
Are the BitBulls back in town?

possible linkbtc move is 200% up then retrace 40% for 2 yearspossible linkbtc move is 200% up then retrace 40% for 2 years

LINK/BTC to bounce from the 200 MA!As we take a look at LINK/BTC we see that the pair is moving within Descending Triangle pattern. During the last pullback from the Downtrend line we got 2 Bearish Engulfing pattern. The price is testing Support zone and nearby we have 200 MA that has been acting Support as well , so we can expect the soon-to-be RISE⤴️!
If you like the idea PLEASE don't forget to hit the LIKE 👍👍👍button
Also share your thoughts and charts here in the comment ⌨️ section!
Appreciate your time and good luck!😉

Symmetrical traingle on ERDHello, traders.
ERD is forming a bullish symmetrical triangle which is a bullish pattern, and we can be heading up to test the ATH and eventually break this resistance level.
Push the like button and follow us on Tradingview.

Short term correction into Higher time frame supportLINK Created an impulse move to the downside on August 16th, as marked in the form of 1,2,3,4,5 impulse count. Expect another leg down after this ABC corrective wave is finished.
Price should see a dip down to .00092687 in the coming week, that support zone is a key support on the daily chart and I expect bulls to heavily defend that level.
That is where I would be looking to be a buyer for a long term entry.


