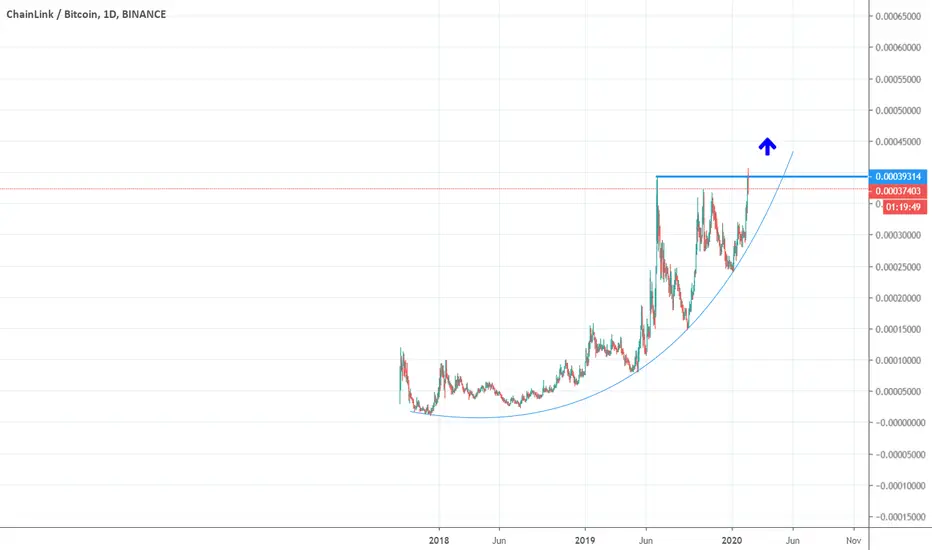
LINK 20% or BUST - Channel BounceLINKBTC looks to be bouncing at the bottom of a BIG channel today, Its been pumping ridiculously the last few weeks so its well overdue a correction and if it breaks down out of this channel I think it will be VIOLENT for those holding but if it bounces here the FOMO will take it 20% probably.
-Respecting large channel
-Has respected channel resistance twice already
-BIG FOMO on this coin right now
LINKBTC trade ideas

LINK going for next moon - Fibonacci / Elliot wave countSee my other posts about LINK. It is absolutely lovely to see where this is going. Very risky trade, but hey, what is new in cryptospace. Next moon incoming!
It seems that LINK is running along this parabolic line (dashed line). Later this evening we could possibly see if this is true. Because of the weakness of the third fibonacci wave it is expected that the fifth wave will be extended. Let's see if this chart will become active.

Linkies 8.16.20 If you are still doubtful on Link , I would suggest that you really take a look at your reasoning why. Is it getting too hot? Maybe. Why is it running up in price so hard vs btc? Well i believe that somebody wants your Linkies and is willing to pay a very high premium on them. Why? Bc they are able to look into the futures in years and understand just how valuable an oracle will be. I really dont even think we've seen the biggest move from Chainlink yet. I see ALOT of ppl saying that they will buy the pullback to 10 dollars. Here is what i think. If it does pull back to 10 dollars it will be so fast it will make your head spin. If you are betting on that i would suggest that you ladder in your orders all the way down to 10 dollars. Too many are waitng on this pullback and I JUST DONT SEE IT HAPPENING.
Long Chainlink
Short the Shorters


Link; another rise incoming?Would this be a third rise for wave in the upcoming days. Let's see where this is heading.


$LINK/BTC Short - Possible Blow-Off Top FormingI think there's a good chance we may be seeing the beginning of a volatile and rapid bearish expansion for $LINK.
We can see a high correlation between Chainlink's chart to a typical market bubble / blow-off top - including an almost vertical, aggressive final phase finishing off with a spinning top on the 12H.
Looking at the hourly chart, we can see that we've broken market structure by having clean closes below the swing low that made the high - this being so much more significant due to it occurring at the -0.27 extension of the daily range that preceded the final run up.
We failed to break back into bullish market structure and have instead retraced back into the hourly supply that made the most recent swing low.
Combining the factors mentioned on the chart above/this analysis with the increasingly widespread euphoric speculation leads me to believe the whales might have found their point of highest liquidity in which to sell in to.
In conclusion, I would be vary wary of entering any long positions at these levels as it seems likely we might be seeing circa $8 again before long. If true capitulation occurs, we could even see sub $5 in the coming months.
I know this won't be a popular opinion, but it's often best to exercise a contrarian view when your analysis indicates weakness and the hype levels are at such a peak.
Thanks for looking - don't shoot the messenger!
FantasticMrFX

could this be the first corrective wave?elliot theorie.
Looks like we finished the 5th waven and now forming the first corrective wave to 0.6 fib level.

LINK CHAINLINK retracement levelsChainlink, Tellor, and Band Protocol all provide what are known as “oracles” for decentralized applications. Oracles connect off-chain data to decentralized applications — a service that has become increasingly important to DeFi.
I`m looking for a retracement to 0.618 level or 0.00085270btc.
If you are interested to test some amazing BUY and SELL INDICATORS, which give the signal at the beginning of the candle, not at the end of it, just leave me a message.

ATS vs LINK/BTCThis is a real diamond, the LINK shows an upward trend for almost 3 years.
You will not find the second one.
Cross pairs Trading is always more difficult.
Besides they are in downtrend mostly, but not our hero.
Script settings for 1D timeframe:
· Signal calculation type - "hl2"


CYBER ENSEMBLE signaled a sell for LINK:BTC.On the daily and on the 3 hrly as well.
There is a significant chance for a retracement to retest at least the red 21 EMA (also where the gray DVI line on the 3hrly is at) at about 0.0013 BTC.
More short-term bearish movement expected if this red 21 EMA on the 3 hrly that have been acting as support during the recent short-term bull run since 2nd Aug failed to hold (see chart above).
Price may then go further down to revisit the gray DVI line on the daily at 0.00108 BTC.
PRISM ANALYSIS
pRSI's STOCHs indicator flashes red (i.e. overbought)
AJ-Ribbon (Acceleration/Jerk) on a downward trajectory being pulled down by the Snap-Oscillator (yellow/pink) that already plunged sharply into the negative. Hence, expecting momentum to fall significantly within the next couple of days.
CYBER CHANNEL ANALYSIS
Price have already reached the D level (i.e. the 7-8 Stdev level) , indicating over exuberance within too short a period of time, and needs to cool down -- either by a retracement, or through time (i.e. sideways/stagnation), or a bit of both; before further upside can continue in a healthy manner.

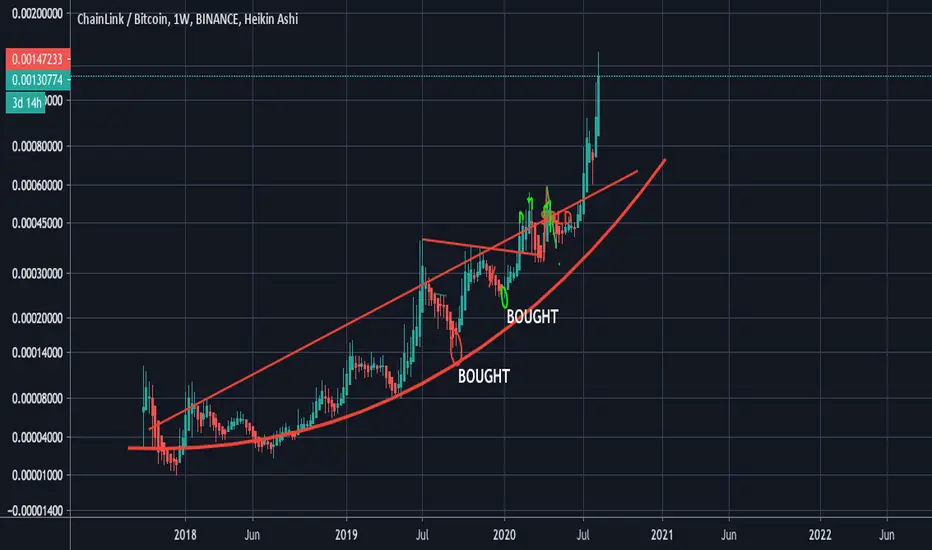
LINK.BTC (Y20.P3.E4).Rare Gems and the Parbolic Curve PatternHi All,
**** This is a continuation of the previous post > LINK-BTC-Y20-P3-E3-TA-on-the-Macro-structure, link below ****
As I am still a junior in this field, I have however learnt something new this week and today to confirm something that just dawned on me, the Parabolic curve pattern.
FYI. I was trying to work out when to sell. Help me if you can?
I don't know much about it besides what I have seen recently on google to know this is it and that it is likely to have 4 base levels.
The issue I have is working out the target.
Some time back (post below) I got the Editor's Picks of the week (and will feature on the page www.tradingview.com). 1st time.
What I didn't know was actually doing a good job at getting the target right (I think, maybe more).
If I had know about this pattern I would have traded it much more successful.
I'm sharing this for others to benefit and to share the thrill of getting things right.
Now if any of you know where I can find out more details about this topic, I would much appreciate it.
For now, I saw a video that stated that the selling point is equal to the Base of (3) x 2.16
If this is correct, then we have 2.16 x 0.00016004 = 0.00034568
and that the Base of (3) x 0.79 with give the base of (4) = 0.0002865
Cheers,
S.Sari
PREVIOUS POST that came to work out OK.

LINK / BTC - Link Hard Pullback Coming SoonLink is in full FOMO mode, and may continue to see higher gains in the short term. I believe a massive pullback is coming soon.
Why - quite simple -- look at volume here on the monthly. Price is rising hard while volume is falling hard

Elliot count on LINK Hello, traders.
How far does the link can go? We believe that this asset is in on a long-term bullish trend and, after breaking an important resistance level we believe that this asset started another bullish uptrend movement we have already completed waves 1 and 2, and possibly we are ending wave 3, after that we identifying a bearish divergence in the RSI.
The target of wave 4 is on the Fibonacci retracement projection.

LINK.BTC (Y20.P3.E5).Buying formationHi All,
(For my benefit, ref: I\Charts)
With each drop, and planning, one can see some potential opportunities.
I see this with LINK.
Cheers,
S,Sari
LINK/USDT


LINK BTC new levelsAnyretest of 100kSats instabuy IMO brief bearish cfork in play.
Oracles still hot property
long n strong

LINK beyond parabolicIf you like my TA or other ideas, please leave a like to show support. It helps me out a lot
-------------------------------------------------------------------
LINK has moved beyond its parabolic curve and is set for a healthy retracement. Volume is smaller than with previous runs and the RSI is exiting the overbought region (this usually is a good thing, but in this case it has historically been a sign of retracement).
I'm expecting a retracement to the 1 FIB (97K sats). If it breaks we might see a return to the curve.
Stay strong marines

Head and Shoulders for LINK!Hello, traders.
What Does A Head And Shoulders Pattern Tell You?
The head and shoulders pattern is comprised of three component parts:
After long bullish trends, the price rises to a peak and subsequently declines to form a trough.
The price rises again to form a second high substantially above the initial peak and declines again.
The price rises a third time, but only to the level of the first peak, before declining once more.
The first and third peaks are shoulders, and the second peak forms the head. The line connecting the first and second troughs is called the neckline.