fib div & macd & moving 200 Hello friends
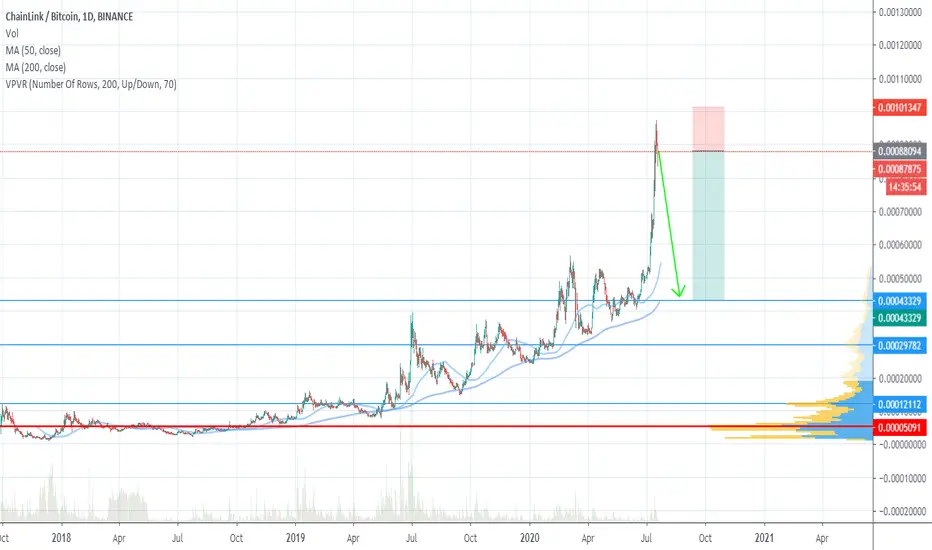
In the picture, you can see the price reaction with Fibonacci. The growth of the price is quite clear.
Congratulations to all of you, my dear subs, who believed in my trading methodology, and challenged the world by being a bull! We deserve to celebrate!
BECOME A MEMBER!
Remember to follow me, I’m a trader who uses the classic technical analysis (barely any indicator, just the candles and the volume ). Like this idea if it helped.
Thank you very much.
* LIKE this idea and FOLLOW me, because:
- Here, you will see clean charts;
- Trades with clear risk management;
- The best of Dow Theory, Price Action and Candlestick psychology;
- Chart patterns with statistics. *
* My name is vahid, I'm a trader and portfolio manager and I'm here to LEARN. Leave your COMMENT and FOLLOW me to keep in touch.
LINKBTC trade ideas

The future of the best performing alt in cryptocurrencyIgnore tranny fud.
Technicals reflect fundamentals.

IMPORTANT Chainlink mindblowing parabolic moveChainlink is unquestionably the most important project in crypto right now. More important then even bitcoin in it's world changing significance. Chainlink is like the invention of the internet, it will herald the 4th industrial revolution and will automate industries that people once thought were safe from automation.
Expect major fud to be released by the chinese and the jews who want to suppress the price and buy up the cheap linkies.
Never sell a link and if you want to be one of the new elites have 10000 Chainlink tokens whilst it is still possible to obtain such a amount.
1000 Chainlink tokens is the minimum for a suicide stack, anyless and you will probably feel pain everyday knowing that you missed your one and only chance to make it.
Never sell a link.


Down Down DownDown for the following reasons
-Reached top of channel
-TD sequential hit a 9 on the weekly
-MacD crossed bearish on the daily


LINK making rising wedge patternLINK is making higher highs and higher lows after being rejected from a weekly support level, making a rising wedge pattern.
Usually, Rising wedge pattern indicates a bear movement.
But here in this chart as you can see, the candles in between the two trend lines are respecting the support and resistance of trend lines.
Link is right now at a very crucial stage, as it is below the daily resistance level. It has to break the daily level in order to continue the rising wedge pattern.
Volume as I mentioned in the chart, is decreasing but the movement is upward rising, indication a VOLUME DIVERGENCE. (Bearish Move ahead).
Volume has to increase in order to break the daily level.
82239 is the daily resistance level, it must be broken then next move would be to test the resistance at 85036.
If you want to long, wait for candle to form above daily level, then move could become bullish up to 85036.
I have described both the situations. Now it's up to you to decide.
I don't create FOMO's. I Just try to give you the clear picture so that trading decision becomes easy for you.
I only make these charts for educational purposes. I am not earning anything, FREE TA.
Good Luck.

LINKBTC Should we rush to LINK already?This is a simple chart and food for thought for those who want to rush on to the LINK wagon. You all know I've been a big LINK fan for a few year now and I've been posting my expectations including those below:
This study is attempting to put the question above into perspective using the behavioral pattern after ATH and the RSI fluctuation.
As you see on the chart, every time LINKBTC makes an All Time High (ATH), the price pulls back below the previous ATH touches (some times marginally breaks) the 1D MA200 and then rebounds to make new ATH. The sequence has been repeated several times since 2018, solid enough to make it a reliable pattern.
On top of that, those MA200 bottoms, have coincided with bottoms on the RSI. As you see there is a clear Buy Zone.
Take advantage of the above factors and jump on the wagon on time for the most optimal risk/reward ratio.
** Please support this idea with your likes and comments, it is the best way to keep it relevant and support me. **


LINK big bounce, Bullish RSI Divergence + Fib Retracement HitLink forming a pretty clear Bullish divergence on the 1 & 2H charts as well as almost perfectly hitting its fib retracement target. Coupled with LINK literally being the most bullish chart in crypto, you gotta be a lil slow to not buy target a long here.

selby_exchange - LINKXBT - Selby Chainlink Price Forecast - .001LINKXBT price/time call
0.00100985
2020-07-25 13:00
Selby finding creative patterns in charts on Tradingview
Not advice for investing, but I am one to watch
Rebellion=Change=Future

ChainLinkLINKBTC It looks like the top of the entire cycle of this incredibly successful project, now we will be looking for support, which we will not find soon.
Best regards EXCAVO


chuchakov*? bearish fork in playlil ways of consolidation for linky, any touch of the trendline below is instabuy