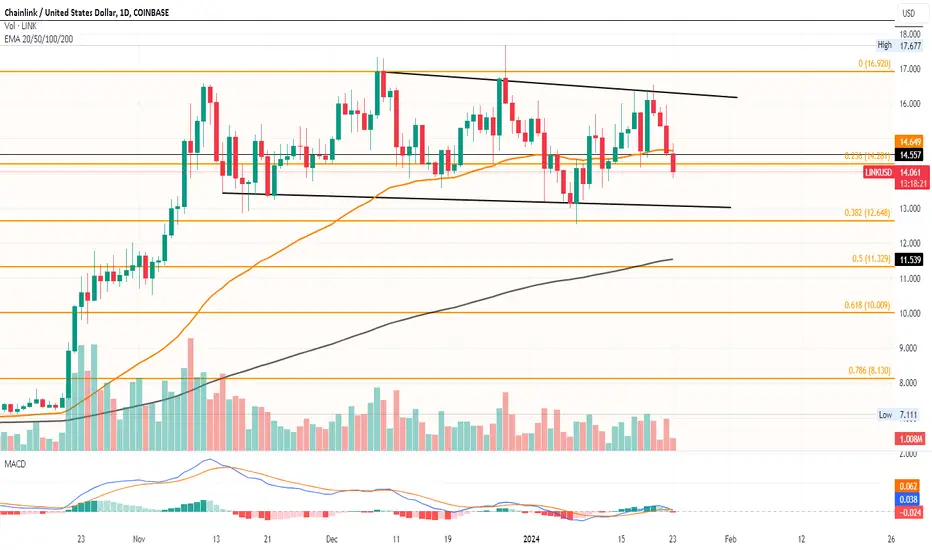
Chain-link: who’s really buying?The potential Wyckoff reaccumulation pattern on the Chainlink (LINK/USD) chart is definitely worth exploring. Let's unpack the details:
Supporting the Wyckoff Reaccumulation:
Price action: LINK has been trading within a defined range with multiple spring and shake phases, potentially indicating accumulation by institutional players.
Volume profile: Increased volume during dips and decreased volume during rises could be a sign of buying pressure at lower levels.
Bullish divergence: While the price has been consolidating, some technical indicators like RSI might be showing bullish divergence, hinting at potential upside.
Cautious considerations:
Confirmation: A clear break above the trading range with strong volume is needed to confirm the reaccumulation and signal potential continuation.
False breakouts: Like any pattern, Wyckoff can be deceptive. False breakouts above the range followed by pullbacks are possible.
Market sentiment: Broader market trends and specific news related to Chainlink could impact its price regardless of the technical pattern.
Overall:
The potential Wyckoff reaccumulation on the LINK/USD chart presents an interesting opportunity, but remember:
Wait for confirmation: Don't jump in based solely on the pattern. Look for a decisive break above the range with strong volume for validation.
Manage risk: Use stop-loss orders and maintain a diversified portfolio to mitigate potential losses.
Fundamental analysis: Don't rely solely on technicals. Research Chainlink's underlying technology, adoption, and future prospects.
LINKBULLUSD trade ideas

✴️ ChainLink 6X Short (290% Potential | For Advanced Traders)ChainLink (LINKUSD.P) continues to move within a distribution phase, lower highs, really low volume... It's been many years since we have a distribution phase across many Altcoins, this is not yet confirmed.
If prices move and close above the last high, 17.68 and continue to hit a new resistance level, instead of distribution we had consolidation. If we see a breakdown happen from this range, we have a confirmation of the distribution phase. It can go either way.
➖ Sell at resistance.
➖ Buy at support.
This is not financial advice.
Leveraged trading is high risk and can result in all money lost.
Do your own research.
We use a manual stop-loss so patience is key.
Trust as well is needed if you don't understand the setup.
Adjust live to market conditions if the chart setup changes.
Wait patiently and the market will take care of everything.
There is always a second, third and even fourth chance... In fact, the market offers endless opportunities on both sides.
👉 Up to 290% with 6X.
Time expectation between 2-4 weeks for the full move to develop, can be a bit more...
There is a strong support at 10.25 before reaching the lower level.
👉 The potential for this target is 195% with 6X.
Thank you for reading.
Feel free to comment with your thoughts and questions.
You are truly appreciated for your time and continued support.
Namaste.

Link ImpulseAFter some wickof distribution, Link started forming something significant where we can track things more easily.
Projected some areas where wave 4 could land.
Lovely and clean count. Everything an Elliotitian wants. Wave 4 could take some time now...


LINK price struggles for a comebackNegative Trend in Falling Channel: LINK price exhibits a bearish cycle within a falling channel pattern.
Formation of Three-Black Crow Pattern: Recent price action in LINK shows a bearish three-black crow pattern, signaling potential downside.
Risk of Bearish Breakdown: Potential breakdown may plummet LINK price to $12 support.
Market Correction Impact: LINK's price is influenced by the broader market correction, fueling a bearish trend.
Bullish Struggle at $17: Repeated failure to breach the $17 resistance level is leading to repeated price drops.
Bearish Pressure at 50-Day EMA: LINK's price is testing the crucial support of the 50-day EMA.
Technical Indicator - EMA: LINK's market cap at the 50-day EMA indicates a struggle for stability.
MACD Indicator on Edge: The MACD nearing a bearish crossover, indicating a potential trend reversal.
Bear Phase Survival Uncertain: LINK's current price movement within the bearish channel raises questions about its ability to withstand a prolonged bear phase.
Possible Channel Breakdown: A breakdown from the current channel could significantly lower LINK's price.
Key Support Levels to Watch: Close observation of the $12 and $17 levels is crucial for determining future price action.
Reversal Possibilities: Any bullish reversal from current levels might lead to retesting overhead resistance levels.
Link Elliott Wave Count Revised Idea, and TargetIn previous analysis that I published this past weekend, I believe I was incorrect about the location of wave 5. I've since updated it. Simpler, cleaner count... I like this one better.
Old analysis:

LINKUSD, EW - Completion of complex wave 4 - $11 targetJust a thought/idea re. chainlink near term.
The higher timeframe 5 wave impulse is not complete, nor does it appear that wave 4 is complete.
I think a move down to $11 is possible in the short term. That said, the A/D indicator (accumulation/distribution) is printing a divergence on time frames lower than 12h. Longer term, I think link is headed to $27.

Support at 200W moving average. Will it break down to test it support at 50WMA or time for fireworks?

Shakeout then runClassic flush before a nice run higher. Next leg up for link is starting now with targets
of $23 and $28.

LINK in consolidation with bullish potentialCRYPTOCAP:LINK is consolidating in a bullish flag. I'm looking for a $17 entry mark, testing support and heading up to next resistance area.
If support broken, then I'm entering at the $5 lows for a long position with major potential for big gains in the future.

Chainlink and Wyckoff.I know most traders are skeptical and mega bearish now because of the Bitcoin weekly close. I’m wondering if some blue chips alts take off while btc dominance falls.


LINK - LongGood luck to everyone! This analysis is for educational purposes only and does not constitute financial advice. Conduct your own analysis before making trading decisions.

$link long After btc etf market is overall bullish , i expect alts to pump . targets of link in chart

Link Intraday 4H, Elliott wave countAfter completed 5 waves up, we are looking lower against 6.507, to complete an ABC correction, wave (2), with possible targets 0.5-0.618 fib retracement.
Hit the like button if you like my analysis and follow me for future updates!
Future updates will be posted as updates to this count.
Daily intraday updates on 1H and 4H time frame, don`t miss them!!
Good luck!

LINK/USDTI am sure so many people feel left out with the BIST:LINK buzz and missing out on them sweet gains after that accumulation breakout, well I have good news for you, you have a second chance, set alert on that orange diagonal resistance because you can trade the breakout up!
key notes here is, the ascending channel was a signal of a break down!
many faded this, I dont think we will come down to blue support line but if we do, buy!

LINKUSD (4H) - Bearish breakoutHi Traders
LINKUSD (4H Timeframe)
The market is in a downtrend, and we are waiting for an entry signal to go SHORT below the 13.180 support level. Only the upward break of 14.790 would cancel the bearish scenario.
Trade details
Entry: 13.180
Stop loss: 14.790
Take profit 1: 12.200
Take profit 2: 10.600
Score: 6
Strategy: Bearish breakout

LINKUSD (W1): Buy stop at 1.68 for this year!COINBASE:LINKUSD LINKUSD (W1) shows positive signals.
With signs of slight correction after a strong price increase. We can expect a return and stronger growth of Chainlink coin.
Specifically, the signs are shown as follows:
The level of price increase is fast and strong: Increases nearly 200% after 12 candles or 84 days
Volume increases when price is pushed up: Volume is above the 50-session average when price increases sharply
Weak bearish correction: Price is always greater than the Fibonacci retracement level 0.382
So, let's set up a buy order when the price reaches 16.8.
Stop loss at 13.5 and wait to see how far the market will take this currency exchange rate.
Merry Christmas!

Chainlink - bearish back-up scenarioAs back-up & not highly likely IMO
The bearish Chainlink scenario useful to...
1 - find invalidation point as confirmation for bullish investment
2 - be prepared for sudden Crypto panic & fear mode
3 - find good levels to DCA more coins
It was hard not to see the bullish outlook for Link🤣
Comments💭, Likes♥️ & Follow🔗appreciated🤗
Disclaimer:
Not financial advice
Do your own research before investing
The content shared is for educational purposes only and is my personal opinion

Bullish Momentum Points in Chainlink Eyes $25!Recent Surge: LINK price witnesses a substantial 10.67% jump, highlighting an increase in buying pressure.
Rounding Bottom Pattern: The ongoing rally in Chainlink aims to complete a rounding bottom pattern in the weekly chart, a bullish signal for potential trend reversals.
Key Neckline: The neckline of the pattern is positioned at $18.38, marking a pivotal point for the bullish breakout.
Breakout Potential: A successful bullish breakout could propel LINK prices toward the $25 mark.
Market Dynamics: Bitcoin's recent climb to $43K boosts overall market sentiment, benefiting altcoins like Chainlink.
Technical Indicators: The weekly 50 and 200 EMA indicate a golden crossover, a strong bullish signal in LINK's price chart.
DMI Indicator Support: The VI lines in the DMI indicator show a bullish crossover, adding to the positive outlook.
Current Trading Price: LINK trades at $17.27, showing a strong potential to challenge and surpass the $20 level.
Year-to-Date Growth: LINK has seen a substantial 215% gain this year, making it one of the standout performers in the altcoin sector.
Next Levels to Watch: If LINK sustains its upward trajectory, it could challenge the $20 mark and potentially approach the $23 level, aligning with the 38.20% Fibonacci retracement.
Potential Reversal Risks: A reversal below the $17 mark could lead to a retest of lower support levels around $15.

LINK beautiful consolidationFrom first glance the next level looks 25 - 30 dollars to me. We are about to break this range soon.
Im watching twitter and most people are predicting 100 - 150 dolars link, which will align with last bull market tops of some coins that reached around 100B MC, but i think people are underestimating how much money can flow in the market after the ETFs.
Why cant blue chips reach 200 - 300B MC at the top of the cycle if the entire market is worth 7- 8 Trillion? We really dont know how wild things can get.

link usd - still waiting for the shorti am still waiting patiently for the down ward movement to start.
i think i might need to wait for another two to three weeks.
lets wait and see what will happen during the month of January 2024.
next update will be in 4 days and 15 hours, after the weekly close.

The Four Market phasesAccumulation:
Makers accumulate assets before most investors.
Range 6 months and higher after decline.
This phase is usually marked by flat movement.
Accumulation occurs in a gradual manner to avoid significant price changes.
Advancing:
The Market begins to grow upwards. A trend is formed, which gradually attracts more and more new investors,
which subsequently leads to an increase in demand.
As the market moves upward, other investors are encouraged to enter the market.
As a result, the excitement affects more people who want to participate.
During such a period, demand is much higher than supply.
Distribution:
Sellers sell their profitable positions to those who enter the market at a late stage.
As a rule, the distribution phase is marked by a flat movement, which absorbs demand until it is exhausted.
4th stage - Decline
At this stage, supply dominates and the price goes down almost nonstop.
In other words, after a significant portion of stocks are sold, the market begins to move downward.
Eventually, supply becomes much greater than demand, and a downtrend sets in.
