CHAINLINK PATH TO 90 USD by Q4 2023.A potential scenario for COINBASE:LINKUSD Based on 2019 repeating pattern.
LINKBULLUSD trade ideas

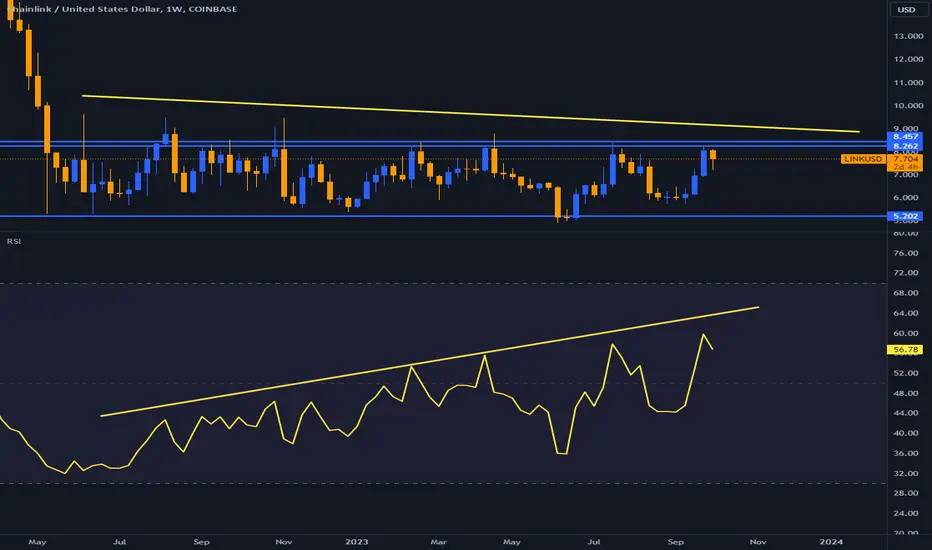
[C-019] ChainlinkTrading idea number C-019 | Chainlink (LINK) may rise to to 8.875 USD area.
The RSI is above its neutrality area at 50. MACD is positive and below its signal line. In addition, price is trading below its 20-period moving average but above its 50-period moving average and pivot point, where we expect a rebound to the R1 point at $9
📈 Long Entry at 7.50
💰 Take Profit at 8.875
💸 Stop Loss at 7.045

Chainlink Roadmap ($200?)(Chart above Green Line - November 2024 , Red Line October 2025)
There are some amazing things happening right now on the Chainlink chart. It may seem like LINK is still in a boring range, but for me, it's quite the opposite. This move down to $5 was the best that could have happened for LINK.
We documented this entire move down to $5, and you can check it out below:
The bar pattern you see in front of you on the main chart above is taken from December 2018 to May 2021. Why so specific in December 2018? Well, if we zoom into the Daily timeframe, you can see a clear mirror pattern appearing. This move down to $5 confirmed to me that, in fact, Chainlink has been playing out a very similar fractal since its first and only bear market, starting from November 2022 (FTX crash).
This is an incredible find! Just look at it; it's undeniable!
The last wave from December 2018 looks pretty much the same as the one we had in June 2023; it even took the same time at the bottom and to pump back up to the range high.
The only major difference here is that in December 2018, this final wave set a higher low, but this year we set a lower low:
Now, let's talk about Fibonacci time sequences:
I forgot about this time count, in October 2022, I marked it as failed because we didn't get a reaction from it anymore, but I stumbled upon it in an old chart save, and wow, it did, in fact, mark the bottom of wave 5 and pivot up.
If Chainlink does repeat the last cycle, then this October 2023, Chainlink will have a massive run-up to an all-time high:
So, out of the last five Octobers since this chart started in 2017, Chainlink has finished the month positively every time except for the first:
Oct 2017 -55%
Oct 2019 +49%
Oct 2020 +28%
Oct 2021 +19%
Oct 2022 +2.75%
Keep in mind that this chart starts in September 2017, so this October we could see a big move up or the start of it. If Chainlink behaves like the last cycle, it rallies to all-time highs.
Remember that Chainlink broke all the high four times before Bitcoin finished its cycle top:
If Chainlink breaks the 3.618 Fibonacci level four times again, LINK would go over $1000:
I put this outcome as unlikely since it takes a lot more money to move this market cap to those numbers.
This TA assumes that Chainlink will follow more of the Bitcoin cycle, as that's what coins that run through the cycle once and significantly increase the market cap tend to do.
LINK/BTC
This time sequence started everything , put everything in motion for chainlink for me , since then its been right at predicting Chainlink events 100% of the time for years , the next date is April 2024 which happens to be the next Bitcoin halving, things are going to get really crazy around this time expect anything.

A Breakout and a Bull RunBeautiful Cup and handle pattern on the daily. A breakout could be the start of a Bull Run!


Can LINK Reclaim Momentum To Avoid Crashing?Cup and Handle: LINK forms a potential cup and handle pattern in the daily chart.
Approaching EMA: Downtrend is nearing the 50-day EMA.
Overhead Trendline: LINK struggles to challenge the overhead resistance.
Market Volatility: Uptober rally slower than anticipated.
Golden Crossover: 50 and 200-day EMAs sustain a positive alignment.
RSI Indicator: Sharp downfall from the overbought zone.
Breakout Failure: Intensive supply inflow keeps the trendline intact.
Bearish Reversal: Weekly chart shows a strong bearish reversal.
Higher Low: Possibility of a new higher low within the channel.
Bullish Failure: Rise in selling spree warns of a bullish failure.
Crucial Support: Support levels at $7 and $6.50.
Potential Reversal: Slim chances for buyers to reclaim trend control.

WEDGE BREAKOUT ON LINKWE HAS OFFICIALLY WICKED ABOVE THE WEDGE WE HAVE BEEN IN ON LINK FOR THE PAST YEAR!
This is perhaps the long awaited break out for LINK

LINK - Quietly Warming Up 👀LINK has not been doing much but it is a coin that many think will have a bright future.
When coins sleep & slump they are a little dangerous but LINK has been sleeping for over a year and its holding well.
It did look a little dicey in the summer but it has recovered well; hopping above the all important yellow 50 week moving average and maintaining sideways drift within the blue trading range.
Now if we look at LINKBTC;
With overlapping lows it is starting to look like a Wyckoff accumulation with the June low not making much price discovery below the May low.
So far it has not exceeded the 50 week moving average other than in a shakeout on the potential AR Automatic Rally bounce.
Its currently challenging that 50WMA again and if it gets above then it could be quite a clue that LINK is entering a bull market.
It is a little choppy here and one way or another we may see LS Left Shoulder Support re-tested to potentially print an Inverted Head & Shoulders Pattern.
If it re-tests LS support on LINKBTC but yet holds above the 50 week MA on LINKUSD then that would be an ideal entry both buying positionally on LINKBTC but also buying into strength on LINKUSD.
This can happen if BTCUSD moves up but LINKUSD continues to drift.
So we are making are first entries here and on a re-test of the 50WMA, then later will look at buying more on a LINKBTC re-test of LS Support.
Not advice

Be carefulPlease, don't chill, don't to be too greedy.
Be careful with it.
There a big bearish hidden divergence in weekly.
LINK Short - Zig Zag, wave C correctionThis looks like it might be a zig-zag correction, with wave C just beginning. I've mapped out expected pattern.

Will LINK Rise Above the Long-coming trendline?Cup and Handle: LINK displays a potential cup and handle formation in the daily chart.
Resistance Challenge: The uptrend is challenging the channel's resistance, hinting at a breakout.
Target Price: LINK aims for the $10 mark upon breakout.
Current Price: Trading at $7.732 with a 4% growth in the last 24 hours.
Bullish Sprouting: The daily candle forms a bullish sprouting, indicating strong momentum.
Golden Crossover: The 50 and 200-day EMAs are teasing a golden crossover.
DMI Indicator: ADX line remains high, reflecting strong momentum, but VI lines struggle to avoid a bearish crossover.
Rounding Reversal: The price action shows a rounding reversal pattern.
Optimistic Sentiment: Market sentiment is extremely optimistic for LINK.
200-Week EMA: A rally could reach the 200-week EMA at $9.065.
Potential to $12.75: A breakout could lead to a price as high as $12.75.
Bearish Risk: A breakdown from $5.85 could restart the bearish cycle, potentially reaching $5.66.

Chainlink Bottom Is In. Range Breakout PendingChainlink BIST:LINK has been in an accumulation range for over 500 days. The breakout is coming soon. My bags are packed.

LINK CHAINLINK: Looks Like A Dump Is Inevitable?It has enjoyed a good ride to $8 in recent days, it looks BINANCE:LINKUSD.P is tired, and dip is around the corner.
Right there on the chart, you have a signal on the entry-level and exit levels.
What is your opinion about this analysis? Share it with me in the comment box.
If this analysis makes sense to you, support my idea and follow me for more.
Cheers!

Run it upSwitching btwn the daily, 4hr, and hell, even weekly and 2hr - all indications say LINK might take a small dip here, but it's probably not too late to catch the next wave up, even if you ain't got nun yet. So run that bagel up fam

Compared view looks bullish for Algorand Money flow change Looks like support is breaking and moving to ALGO. Looks like
a strong recovery merge sometime close to the bitcoin halving.
Money flow is restructuring and asset managers are rethinking their
postitions. Support was strong for the year for link and solana but looks like
diversification take profit is coming with a pullback for many overbought cryptos.
Just because bitcoin is bullish doesn't mean altcoins are unless they are seriously
oversold with a strong community like Algorand. Algorand has the highest potential for the
bull market and has 30 million wallet addresses under the project currently. That makes algorand #3 in the crypto industry for holders. This posting is about disclosure and not financial
advice but it looks like money flow is changing to other crypto assets that are oversold drastically with strong support. Algo is a top asset in my opinion moving forward.

Full Breakdown of LINK | Breakout? | 1H, 1D, 1W Charts | NewsLINK Integrations, SHIB vs LINK
LINK, the Chainlink coin, has been the topic of the hour with many still under the radar wondering what the hell it is, and why is it up 16% this week while other alt coins are far behind? To put it short, Chainlink's CCIP (Cross-Chain Interoperability Protocol) has everything to do with it, and with Chainlink reaching a new milestone announcing 10 new integrations with blockchain networks including names like Avalanche and Ethereum, it's bout time you hop on the new evolution of Web3.
LINK is also on it's way up the ranks, with SHIB being one of the biggest meme coins now sits bellow LINK. Bringing LINK to 18th place.
1D Chart
- Wyckoff Distribution: Here to show the phases that which we reside, as you can see we are well past Wyckoff Distribution and are now at a level of support (4.7)
- FIB: We have been sitting here for over a year in consolidation. There has been a consistent pattern where we hit the 0.236 retracement then pullback for a couple months, as you can see we are reaching the level once again for a fifth time.
- Parallel Channel: Shows a steady decline
- Volume: Low trading volume meaning possible breakouts
- RSI: Relative Strength must stay above 40.00
- SMA: What help is this anyways lol
- Elliot Waves: Thought I should include the Elliot waves (ABC) because it was a pattern I was seeing since the last hit of the 0.236.
1H Chart
After crashes both in spring and summer, it was followed by a bullish rally. Both lasted 52 days before there was an uptrend.
- FIB: Summer rally hitting retracement levels, keep eyes out for any rejections
- Indicators: Northing much matters, just keeping an eye on 200 SMA to see if it still plays as a level of support (Summer)
1W Chart
- Stock RSI: Uptrend, getting ready to hit parallel channel and 0.236
- RSI: Probably the biggest thing to point out in this entire analysis is the Bullish Divergence
Bonus Chart
- Please tell me your thoughts in the comments of my analysis where you think the price is going, as it would help me out to make more of these! Thanks!

Is LINK Ready For A Year-Long Breakout?LINK price action hints at a weekly channel breakout.
Channel formation has been active since last August.
Potential breakout rally could lead to a $12.75 price.
LINK price has increased by 22% in recent weeks.
Uptrend challenges the 50-week EMA.
LINK trades at $7.49 with a 7.43% growth in the last 24 hours.
Overall market sentiment is extremely bullish.
Daily chart shows a rounding bottom pattern.
Golden crossover chances are increasing.
RSI approaches the overbought boundary.
MACD and signal lines are in a positive trajectory.
A rejection at the trendline could lead to a downtrend to $5.66.

LINK close to resistanceLINK is approaching resistance region on 1d timeframe the pennant consolidations still in play and short is valid until after breakout
DYOR

Time to leave the accumulation channelLINK is one of the few old timer alts that have really managed to stay extremely relevant and will probably only become more relevant in the future.


CHAINLINK - Add This To Your Watchlist!Here we have the 2weekly chart of Chainlink. We can see that on a higher timeframe, we are still bullish. We have not yet completed the 5 waves. We are currently on the 4th wave which appears to be a WXY correction (breakdown: 3 waves for W, 3 waves for X and 3 waves for Y)
We have almost completed wave X and anticipating wave Y soon.
Once we make that final move down, we can look for buying opportunities. Expecting the bearish correction to finish above the blue structure.
There is a potential for a 2000% trade coming up. Definitely one not to be missed!
Goodluck and as always, trade safe!

Chainlink is the best oracle in the business I'm extremely bullish on BIST:LINK going into next cycle. It's been around 500 days worth of accumulation at these lows but once we break $10, we are off to the races. The longer the base the higher in space. This is one of the best charts out there, and is a top 5 altcoin fundamentally. Base target $110, bull target is $130-$150. #CCIP #Oracle #Marine

LINKUSD: On the rise in the middle of this Channel.LINKUSD is trading inside the 0.5 - 0.618 Fibonacci range of the 18 month Channel Down pattern. The 1D technical outlook is slighly bullish (RSI = 58.592, MACD = 0.070, ADX = 30.217), which means that even though we are not at the start of this uptrend, there is still upside left.
The current rise was achieved after a Low on the 0.786 Fibonacci level. Inside this Channel, every time LINK held and rebounded on the 0.786 Fibonacci leve, it reached at least the 0.236 Fibonacci level. This indicates a sizeable upside profit to be made still. We are long, targeting the 0.236 Fibonacci level (TP = 8.12500).
## If you like our free content follow our profile to get more daily ideas. ##
## Comments and likes are greatly appreciated. ##
