LINK - Swing trade LongOpen 23.6 close at 28. Neutral on most indicators but lots of nice liquidity points on the heat map to look at. We've got some room on fear & greed index.
LINKBULLUSD trade ideas

LINK on the Verge Bullish Breakout Sparks Momentum !Pattern
The chart shows a descending wedge pattern. This is generally a bullish pattern, indicating potential price reversal or breakout to the upside.
Breakout
The price has broken above the upper trendline of the wedge. This breakout is a positive signal, suggesting that bullish momentum is building.
Volume Confirmation
Check if there’s an increase in volume during the breakout. A breakout with strong volume provides confirmation.
Retest
After a breakout, it's common for the price to retest the previous resistance (now turned support). Waiting for this retest can provide a safer entry point with reduced risk.
Targets
First target: The recent swing high near $24.50.
Second target: $28.50, where there’s visible resistance.
Risk Management
Place a stop-loss below the breakout level or the lower trendline of the wedge in case the breakout fails.

CHAINLINK - Buy Idea (Short-term)The upside reversal is shifting into higher gear. The breakout of the trigger level of 21.60 is happening right now. If confirmed, this would be a string indication that price action is ready for the next phase of this current bullish cycle. We have fired off a new bullish campaign, targeting the big key-level resistance of $25.60

LINK 1-hour Run Chart..Still searching for the Long EntryI know almost impossible to predict PA. Honestly this is sorta the PA I am expecting to happen. So.. I am thinking..
#1 pretty much a dip from here.
#2 then a stronger upsurge.
#3 then back down to a new Lower Low.
I also Published that Daily LINK chart, which annoys me, because it takes way too long to see the next bar. That's why I made this one.
Currently I am loosing confidence in the $16 price range... and $18 currently is looking like it can happen.
All in all.... PA could just all of a sudden go up 30% in the next few days and we all miss out on the entry, but...I think, that is a slim chance right now.
I kinda see a 5% to 10% price scalping opportunity for those traders that are closely watching ... This has a good chance to materialize. It is shown with the 10.01% yellow Price Range graphic. However where ever the most recent low ends up to be, is where the 5% to 10% range will be.
Good Luck, will post updates.

LINK on the Brink: Is a Deeper Dive Coming?Yello, Paradisers! Are we about to see #LINK take a nosedive? The once-reliable November ascending support is showing cracks, and an ominous inverse head-and-shoulders pattern is now on the radar. Could this signal a deeper correction on the horizon?
💎#LINKUSDT is at a critical juncture as the price inches closer to the $19.80 neckline support. If this crucial level breaks, it could trigger a deeper correction, aligning perfectly with the inverse head-and-shoulders pattern target. A breakdown would likely send LINK tumbling into the $17.35–$16.60 range—a zone of strong support that could ignite significant short-covering activity.
💎While this area has the potential to act as a solid bottom, but make no mistake—if the bulls want this region to act as a solid bottom, they’ll need to bring their A-game with a prolonged consolidation effort to soak up the remaining selling pressure.
💎On the flip side, resistance is mounting. LINK faces immediate resistance at $22.00, a level that recently flipped from support to resistance. However, the real challenge lies further up at the $27–$28 zone—a stronghold that continues to keep the bulls in check and make their task increasingly daunting.
Patience and discipline are key here, Paradisers. The market often tests both bulls and bears before making decisive moves, so stay vigilant.
MyCryptoParadise
iFeel the success🌴

LINK, watch out the liquidity hunt!Hello everyone,
if you haven't already on chart, load this fantastic indicator from Alien_Algorithmus. It shows you the liquidation levels of big positions in crypto assets, which is helpful to forecast the trend. Actually we have still some liquidity below left, but on the other hand, above is way more. Whenever you see that some many "clouds" are building in a general bull market it's very likely the chart will hunt this zones.
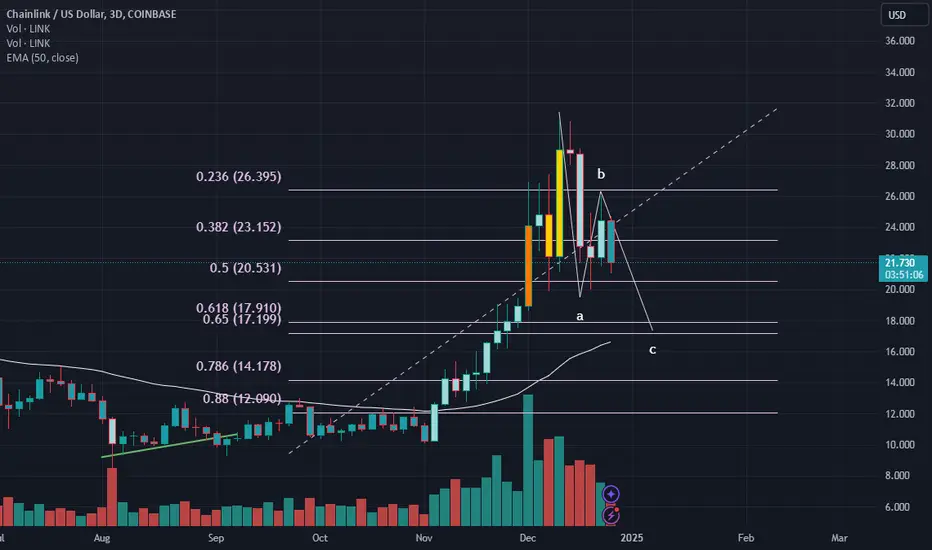
Also we are at the golden ratio level between 0.5 and 0.618 and we have a good structural support. I believe we can see a bounce here, maybe even the start of the fifth wave towards 40 USD.

Head & Shoulder on LINK - > Price will go downif the H&S is confirmed with BItcoin leading the path, Target should be around 15$

Crazy Chainlink Pumps - What do you think?What do you think of these massive Chainlink pumps at different times on the LINK/BTC and LINK/USD charts.
Link/BTC -> June 8th, 2020
Link/ U.S. Dollar -> May 7th, 2021


Chainlink ($LINK) Dips 10% Amid Ripple PartnershipA Game-Changing Partnership
Chainlink ( CRYPTOCAP:LINK ), known for its role as a blockchain abstraction layer enabling universally connected smart contracts, recently announced a groundbreaking partnership with Ripple. The collaboration aims to integrate Ripple’s RLUSD stablecoin into Chainlink’s decentralized oracle network, boosting its utility across decentralized finance (DeFi) ecosystems.
Launched last year, RLUSD has been making waves in the stablecoin market, with Ripple positioning it as a competitive alternative in the space. The integration with Chainlink will bring RLUSD into Chainlink’s price feed system, enabling secure, real-time transactions on both Ethereum and XRP ledgers.
Jack McDonald, Ripple’s SVP, emphasized the importance of trusted data for maintaining stability in DeFi. “By leveraging the Chainlink standard, we bring trusted data on-chain, further strengthening RLUSD’s utility across institutional and decentralized applications,” he stated.
Chainlink’s Chief Business Officer, Johann Eid, highlighted that the partnership is a strategic move to accelerate RLUSD adoption. By providing reliable on-chain data, the collaboration sets the stage for RLUSD to scale seamlessly within the DeFi space.
Technical Analysis
Despite the positive news, CRYPTOCAP:LINK saw a sharp 10% decline, with the asset currently trading at oversold levels. The Relative Strength Index (RSI) sits at 25, indicating significant overselling pressure. This presents a dual narrative: while the dip may raise concerns, it also offers a potential buying opportunity for traders and investors.
The 1-month low axis serves as an immediate support level. Should this level hold, it could act as a strong barrier against further selling pressure, potentially catalyzing a reversal. A break above the 38.2% Fibonacci pivot point would confirm a bullish recovery, driven by renewed optimism around the Ripple partnership.
Market Sentiment and Outlook
The partnership between Chainlink and Ripple has the potential to redefine stablecoin utility within DeFi ecosystems. With RLUSD poised for broader adoption and Chainlink’s proven track record in delivering secure oracle solutions, the collaboration is a win-win for both platforms.
The recent dip in CRYPTOCAP:LINK may be a temporary market reaction, as fundamentals remain strong. Investors should monitor key technical levels and capitalize on the oversold conditions to position themselves for a potential rebound.
Conclusion
Chainlink’s ( CRYPTOCAP:LINK ) dip, despite its promising partnership with Ripple, underscores the market's volatility. However, the long-term prospects of this collaboration point to a significant boost in utility for RLUSD and an enhanced DeFi ecosystem. For investors, the current oversold conditions could present an ideal entry point as CRYPTOCAP:LINK gears up for a potential rebound.

LINK daily -- hunting Chainlink for a Long entryYeah, so I think I will throw in ... 10 Bens on this ($1,000.oo).
when?
When the price goes lower.
$18 area looks like a solid support and turning point.
$20.20 area looks like a quadruple bottom? Is that the lower floor? Not so sure.. that's why I like $18 line.
Now $14 area is sketchy, Yikes!!!
Will watch the indicators falling, maybe $16 is the catch-all support.
It is interesting that I expect LINK to fall and I still have longs active. I mean I am hoping for 25% lower prices.. What's that doing for my active longs.. OH GEEZ.... sometimes ya gotta just HODL some of them.
Honestly it is too early to really tell how the indicators are going to fall, for how long and how deep. What we have here is....anticipation target areas. Eventually (this year probably this quarter, PA on LINK will surpass $25 and probably hit $31. So I do have my bias expectations for LINK's future PA.
Now I did do a small $260 trade and sold out at $320, a solid 20% gain for about a 1 month hodl trade.
Chainlink has some momentum going on with the European community. I think that volatility will continue to be strong with LINK.

Link idea - Billions 4.12.2023Possible volume marked in the zones, and 2 AHTUNGS, #1 - TP ,and in the other lets lunch Billions Breakout Bot

LiNKChainlink:
it is no surprise that pullbacks will always occur in the market and most times a sustained pullback can turn to a trend change.
the charts i am about to show you below, signifies the next possible movements for link based on its charts and following its trend as well this 4 hr chart shows how the orders are flowing and the orange circle tell the recent points at which price seks to take liquidity from before continuing the up trend. the best way to take advantage is to use the 15 min as price approaches that point of interest.

Inverted Head & Shoulders on LinkPer my analysis on Link it appears that its finishing its formation of a massive inverted head and shoulders that can be seen from a weekly or monthly chart. I expect a potential flush to retest the neckline as support or retest the EMA's prior to a bounce to higher highs (this does not need to happen but it will be healthy consolidation for the asset to continue on its move). Overall per the charts it looks like 2025 can potentially be very bullish for Chainlink.

LINK may go to $33 soonLINK is breaking out of an accumulation zone and completing a cup and handle formation with a measured move in the $33 region.
Watch for the resistance zone above $33 for a potential stall out of the move; however, if it can break that level, then we can easily move much higher.
Remember, BTC finally diverged from the market today. This could be the beginning of ALT season that we have all been waiting for since late December.

Shampoo formation on LINK- head and shoulders have a low hit rate when it comes to playing out in a bull market
- that said, LINK is in a very clear hs that is not only present on the daily but on the 2D and 3D chart as well
- if there ever was a time for a shampoo to actually breakdown, this would be it
- target more than 20% lower

link updatewe are still valid for a potential c-wave down on link if we dont see a reversal or breakout on the up side this is what i believe will happen. we will know most likely by next week if we have a lower low or a break out to the up side.
Chainlink Head and Shoulders
The Chainlink head-and-shoulders pattern is preparing to target an area of 11-12. The entire market is aiming for levels seen before the election.

Short term long Chainlink 1H Forgot to post but I entered a short term long position here.
Price hit a strong demand zone and the pattern shows multiple pinbars
Strong setup


Chainlink Price target $757Chan link is in wave 3. The completion of wave 3 in the future will be $757 price target which is the 141 Fib reversal.

LINKUSD "CHAINLINK" Crypto Market Heist Plan on Bearish Side🌟Hi! Hola! Ola! Bonjour! Hallo!🌟
Dear Money Makers & Robbers, 🤑 💰
Based on 🔥Thief Trading style technical analysis🔥, here is our master plan to heist the LINKUSD "CHAINLINK" Crypto market. Please adhere to the strategy I've outlined in the chart, which emphasizes short entry. Our aim is the high-risk Green Zone. Risky level, oversold market, consolidation, trend reversal, trap at the level where traders and bullish robbers are stronger. 👀 So Be Careful, wealthy and safe trade.💪🏆🎉
Entry 📉 : You can enter a Short trade at any point,
however I advise placing sell limit orders within a 15 or 30 minute timeframe. Entry from the most recent or closest high level should be in retreat.
Stop Loss 🛑: Using the 4H period, the recent / nearest high level.
Goal 🎯: 16.000
Scalpers, take note : only scalp on the Short side. If you have a lot of money, you can go straight away; if not, you can join swing traders and carry out the robbery plan. Use trailing SL to safeguard your money 💰.
Warning⚠️ : Our heist strategy is incompatible with Fundamental Analysis news 📰 🗞️. We'll wreck our plan by smashing the Stop Loss 🚫🚏. Avoid entering the market right after the news release.
Take advantage of the target and get away 🎯 Swing Traders Please reserve the half amount of money and watch for the next dynamic level or order block breakout. Once it is resolved, we can go on to the next new target in our heist plan.
💖Supporting our robbery plan will enable us to effortlessly make and steal money 💰💵 Tell your friends, Colleagues and family to follow, like, and share. Boost the strength of our robbery team. Every day in this market make money with ease by using the Thief Trading Style.🏆💪🤝❤️🎉🚀
I'll see you soon with another heist plan, so stay tuned 🫂

LINK - Long This is the perfect setup for a long position its been 2 days since the crash and normally day 3 everything stabalizes and pumps back up if you put a position in now wait for it to pass the 27$ price point hold for about a day or two
