#btcstarburst Link TIme?Update… is it Chainlink time for a minute in a bear be careful.. It does look like a doubleDCA safely… a Gann Study
LINKBULLUSD trade ideas

LINK bottomed twicelink has seen two bottoming trends
It will break out after breaking the neckline
I expect a high probability of a breakout
Follow me to take you to achieve financial freedom

Link double bottomLink has formed a double bottom with a possible breakout of the descending channel. First targets are $7 and $8. Break out of the descending channel has a measured move at $18. The 1.618 of the double bottom is at $12.15 .
The CCI is currently in an uptrend.

Chainlink , Where do we go from here????Holding resistance as support @ $12 range. If this fails, It is possible to hit $7-$8 for support. Currently sitting at the bottom of the right shoulder. Could we have a nice W pattern setup? Can we recover to $30? Watch the current positioning, if this drops below $12.50 we can grab our scuba gear!!!

LINK: mixed selling and buying ordersDuring the previous week LINK lost some 20% in value from the week before. If we take into account general market circumstances and strong downtrend on the crypto market, this was not such a bad performance. This comes especially as LINK was traded in a sort of mixed mode, with equal share of both selling and buying orders. Of course, there is some probability that so-called “whales” are trying to sustain price at some levels, still, there is no available public data over their impact on the price of LINK.
RSI started the week modestly below level of 50 and moved down to 38. It seems that the market is still unsure whether to head the price toward the overbought or oversold market. Moving averages of 50 and 200 days continue to move as two parallel lines with clear downtrend, not indicating that potential cross is in store anytime soon.
LINK is ending the week testing support line at $6. There are no clear indications that this level might be breached to the downside, but still, it should be confirmed within the next two days. In case that market is still not finished with correction, there is some probability for the price to be pushed further down to the level of $5 support line. However, if the current bottom line is reached, there is a probability that the price might turn again to the level of $7.
Disclaimer: This article provides exclusive views of the author. It does not in any sense represent a suggestion for trading.

Chainlink Bear FlagOut of all the bear patterns we are seeing in the markets right now I think Chainlink has by far the best pattern to trade very clear bear flag .
Target breakdown would be 3.6 dollars


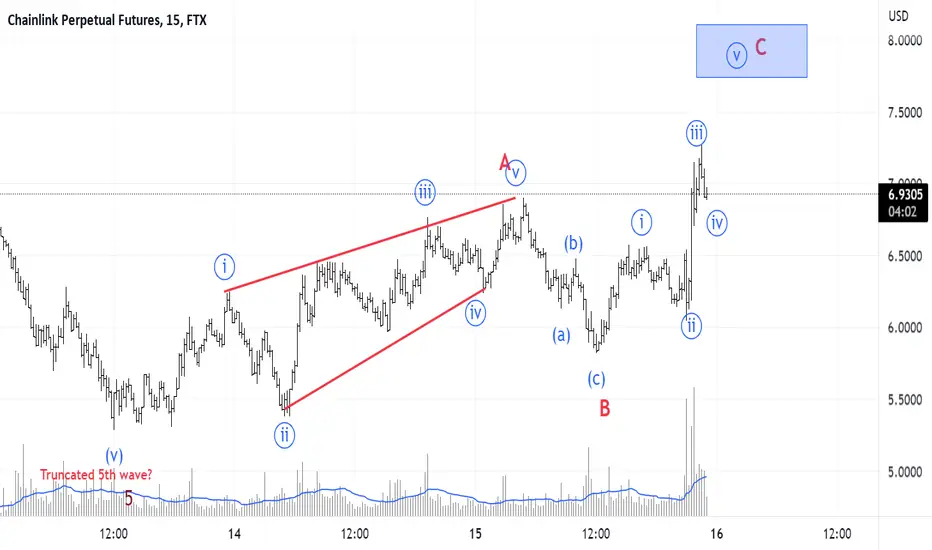
LINK/USDT Elliott Wave CountHow can Chainlink go bullish?
We can have a trucnated 5th wave and now an impulse move to the upside 12 12.
I wont trade this untill more confirmations from the price action!!!

LINK Army Hodl The Door!LINK looking prime for a drop to sub $1, when this correction is over! After a little dead cat bounce and continuation to the down side. None of my 4 indicators showing any bullish confirmation on the Weekly Time Frame.
- Weekly MACD ( Bearish )
- Weekly Pekipek's Divergence BETA ( Bearish )
- Weekly RSI ( Bearish )
- Weekly Stochastic RSI ( Bearish )

Hidden Bullish Signal on chainlink??: Is this what a hidden Bullish Signal looks like?? Looks like a bull to me 😅

Buy and Sell possibilities for Chainlink Simple chart to guide buy and sell opportunities. This is just a projection. Do your own research.

LINK The trend is your friend!LINK: The trend is your friend! Nevertheless Link is for more an important and crucial infrastructure protocol!


LINK/USDT Elliott Wave CountChainlink elliott wave count update
Target for wave C somewhere at 7.75 - 8.0
LINKUSD ❕ the price is holding the support levelChainlink has broken up 200MA at 30m Timeframe.
Trading volumes declined on the correction.
LINK holds the support level.
I expect price may rise if it fixes above the resistance level.

LINK/USDT Elliott Wave CountChainlink can start something from here?!
I think we have a leading diagonal for wave A or 1 , zigzag correction for wave B or 2 that bounced 0.618 fib retracement of wave A or 1.
Let's see how the market develop from here. I will update count later.
I am long for short term also I am into this trade for at least a C wave.
If you like my analysis please give it a like and don't forget to subscribe for my future counts. Thanks!

Link Short to longPrice is forming a rising wedge.
Short to retest the low and make a nice double on the 4 hr and reverse

LINK diamond reversal Link is a printing a major diamond reversal on the 12H. If the pattern is validated the measured move is 18$ with TP at 12$.
Failure is being range bound.
CCI pulling out of oversold.

LINKETH - MONTHLY BREAKOUT (LONG) $LINK Chainlink $LINK has broken out of a brutal downtrend against Ethereum $ETH. LINK has been bleeding against ETH since August 2020 and finally looks ready to breakout of the trend and hopefully go to new ATHs. Link was the star of last bear market, and as we head into poor macro conditions, it looks like history may repeat itself. LINKETH is also sitting on major support and I'm fairly confident that it will hold strong. This could be another fakeout like we saw a few months ago - but I'm optimistic LINK will start outperforming soon regardless. During the mania phase, the market greatly over valued various L1s, meme coins, metaverse, governance tokens, etc. Its time for a return to normalcy and for only the strongest projects to survive/thrive.

BTCUSDT Key level to SHORTLINKUSDT is in rout to 4.00USD. After 30% retrace we have a pivot point to adding on shorts. Fisher Transform crossing on 2H chart. Prior swing leg downward accomplished. 14.6% hidden Fibonacci Retracement level targeted.

LINK Weekly LINK is one of those coins that will end up surprising everyone. Many of the smart individuals i know believe in the fundamentals. This is a chart where I learned to take wins and losses. Key thing to spot on the chart is the RSI is in a failing wedge. Breakout of the wedge to the topside can signal a reversal. Will update as the market gives data.

LINK/USD Elliot Wave countUpdated the Chainlink count
WXY correction pattern for a 4th wave and now we are into the 5th wave to the downside
I think is already finished 3rd subwave of the 5th wave.
I am expecting a 4th subwave corrective move to .the upside and than last 5th subwave and I think we will see soon the bottom.
Also this days I caught good trades on this move to the downside, hope you too!
If you like my analysis please give it a like and subscribe for my futures counts. Thanks!

LINK: overbought market is postponed? LINK had an excellent start of the previous week, when its price managed to break the $8 long term resistance line, reaching its highest level at $9.6. Resistance line at $10 has not been tested on this occasion. Unfortunately, negative macro fundamentals pushed the price down to level of $7.1 as of the end of the week.
Prevailing buying orders for LINK started to push the RSI up to the level of 61 on its road toward the overbought market. Still, this indicator is ending the week below line of 50. However, in this case it does not look like the market gave up from the overbought territory but it has just been postponed. Moving averages of 50 and 200 days are continuing to move as two parallel lines with downtrend, not indicating potential cross in the coming period.
LINK showed high potential for an uptrend during the previous week. In case that coin reverts this trend, the price might again move back to the $8 resistance line, with some potential that next short term resistance at $10 might be tested. On the opposite side, there is a decreased probability that the support line at $6 might be tested in the coming days.
Disclaimer: This article provides exclusive views of the author. It does not in any sense represent a suggestion for trading.
