LINKETH formed a cypher | Upto 23% expectedPriceline of Chainlink / Ethereum cryptocurrency has formed a bullish cypher and entered in potential reversal zone.
But MACD and Stochastic are still strong bearish therefore I will would suggest to wait for weak bearish signals from MACD or bull cross from stochastic for secure trade otherwise the leg can move more down to form a shark pattern.
I have defined targets using Fibonacci sequence:
Buy between: 0.01098500 to 0.01032429
Sell between: 0.01150778 to 0.01275943
Regards,
Atif Akbar (moon333)
LINKETH trade ideas

This couple is a nice couple to trade withI am pretty bullish on this couple, since I expect both to perform well in the next future. They are also correlated on the use case: ETH is focused on smart contract, the other is doing the same connecting different blockchains (and bitcoin).
Trading this couple is a good idea to maximize the profit, since accumulating is good in any case.
In the above graph, I highlighted buy and sell zones.


LINK/ETH Scalp4H falling wedge and seeing Bullish Divergence with RSI and sRSI.
We could get a nice scalp

LINK:ETH -speculative trade#Mainnet
#0.0056 ETH
Another one of these god damn triangles that we love so much.
It's much more bullish on the ETH chart and everyone is so crazy bullish on eth so you know what else what we sell LINK for this time?
Please don't forget to leave a like!


Not ready to buy ChainlinkIve started to grow interested in this coin primarily becaus the LINKUSD chart looks really healthy and diferent from all the other crypto related assets. But I have to take into account my current ETH long term position and it doesnt look as atractive from here since the current uptrend its awkwardly broadening without printing a clear bull flag and its already close to the top of the chanel, not mentioning the RSI being long due oversold. I might be missing only the last pump but I'd rather buy this coin if it comes back down to the bottom of the channel. Im late to the party.
On the good note. If LINKUSD is going to pump, and LINKETH looks not as good, that might be a very, very, very, lose, small signal that ETH is going to outperform LINK and Crypto market might be bottoming.
The above opinion constitutes exclusive financial advice for myself. Do your own research.


ChainLinkI think ChainLink is doing really well with respect to ETH. It is almost at the all time high with respect to ETH. Just wonder what is going on under the radar?

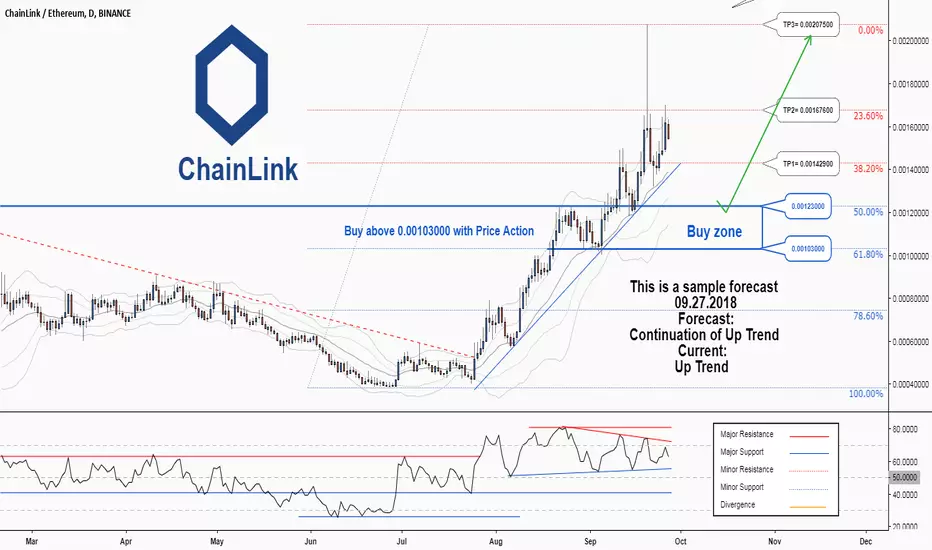
There is a probability of resuming the uptrend in LINKETHTechnical analysis:
. ChainLink/Ethereum is in an uptrend and the continuation of uptrend is expected.
. The price is above the 21-Day WEMA which acts as a dynamic support.
. The RSI is at 62.
. While the price uptrend in the Daily chart is not broken, bullish wave in price would continue .
Trading suggestion:
. There is a possibility of temporary retracement to suggested support zone (0.00123000 to 0.00103000). if so, traders can set orders based on Price Action and expect to reach short-term targets.
Beginning of entry zone (0.00123000)
Ending of entry zone (0.00103000)
Entry signal:
Signal to enter the market occurs when the price comes to "Buy zone" then forms one of the reversal patterns, whether "Bullish Engulfing" , "Hammer" or "Valley" in other words,
NO entry signal when the price comes to the zone BUT after any of the reversal patterns is formed in the zone.
To learn more about "Entry signal" and the special version of our "Price Action" strategy FOLLOW our lessons:
Take Profits:
TP1= @ 0.00142900
TP2= @ 0.00167600
TP3= @ 0.00207500
TP4= Free
Near finish of long term symmetric triangle Lower highs and higher lows, LINK/ETH has tested and kept within the general trend for quite some time. Looking for a bullish continuation in the near term, with a new ATH not out of question. Bags are surely packed and with recent Ropsten node release, fundamentals are locked in as well. Link/BTC has already broken out previously, this may be a precursor. Looking forward to short term movement and resolve.


Historically speaking...... we should see some modest gains this week. Oracles are needed!
DYOR - NOT ADVICE

LINK - Going to watch carefully ... ... should drop to lower support and then get a good bounce. Buying on 4/13.
NOT ADVICE


LINK LongLoving the action on LINK/ETH, especially during a time of strength for ETH
It's been putting in a very nice channel and lately formed a base from where it's tested the longer downtrend
The next day will need to have some more volume come in
If this is the case, the previous high would be the target - about a 30% move if you consider this triangle (not giving to much importance to the big spike candles that gave back all their gains a day later)

LINK - looking interesting here. Waiting for retracement to buyThis thing is finally moving. I'm looking for a retracement to support (green line) and will be buying more then.
