Maybe....Just maybe. If the the Inverse Head and Shoulders pattern plays out, the measure move would take us upwards of roughly 30%.
Based on Volume, FIB and Indicators, next target will hit 11.292.
LINKUSD.P trade ideas

A confirmed breakout of linkusd’s daily falling wedge = $8.58If it confirms the target is around $8.58. Confirming this breakout would likely ensure the recent golden cross is sustained as well. *not financial advice*

Link's Ongoing Struggle At $7.6 Hopes For A Breakout To $11(Link), one of the leading cryptocurrencies in the market, has been locked in a seemingly endless struggle to breach the 7.6 dollar price point for several months.
The cryptocurrency market is no stranger to volatility, but Link's stability at this particular price range has caught the attention of investors and analysts alike. In this article, we will explore the factors contributing to this prolonged struggle and examine the potential catalysts for a price breakout that could propel Link to $11.
Understanding the $7.6 Resistance
Link's performance in the cryptocurrency market has been impressive over the years. However, since , it has been unable to sustain a significant upward momentum beyond the $7.6 mark. To understand this resistance, it's essential to look at the various factors influencing Link's price.
Factors Contributing to the Prolonged Struggle
Market Sentiment: Market sentiment plays a vital role in determining the price movements of cryptocurrencies. Negative news, regulatory concerns, or general pessimism can create downward pressure on a cryptocurrency's price. Link has faced its share of setbacks and FUD (fear, uncertainty, doubt) in recent months, which has contributed to the struggle.
Resistance Levels: Technical analysis often highlights significant resistance levels that can act as barriers to price movement. The $7.6 level has been a formidable resistance point for Link, with traders and algorithms reacting to it.
Overall Market Conditions: Cryptocurrencies are also influenced by broader market conditions. A bearish market can make it challenging for any asset to rally, while a bullish market can provide tailwinds for significant gains.
The Potential Catalysts for a Breakout
Despite the challenges, there are several factors that could potentially drive a breakout for Link, with a price target of $11
Technical Analysis: A break above the $7.6 resistance level could trigger a surge in buying interest, pushing Link's price higher. Traders and algorithms often follow such breakout patterns.
Fundamentals: Chainlink's fundamentals remain strong, with its decentralized oracle network being widely used across various industries. Adoption of the technology can create sustained demand for the cryptocurrency.
Positive Developments: News and developments related to Chainlink's partnerships, integrations, and projects can significantly impact its price. Positive news can rejuvenate investor interest.
Chainlink's extended struggle at the $7.6 price point has frustrated many investors, but it's essential to understand the myriad of factors that have contributed to this situation. While breaking the resistance will not be easy, there are several potential catalysts that could pave the way for a significant breakout, with a price target of $11.
Investors should closely monitor the market sentiment, technical analysis, and the broader cryptocurrency landscape for signs of a potential turnaround. In the volatile world of cryptocurrencies, one thing is certain: surprises are always around the corner, and Link may yet surprise the market with a remarkable rally to $11.
As with all investments, it's crucial to exercise caution and conduct thorough research before making any decisions in the cryptocurrency market. check for plagiarism.
LINK - capped at $10 or room to run? Big weekend move with Chainlink. Fundamentals aside, we have been ranging between 5 and 10 for some time now. We approach the top of the range and I don't believe this is the time to be longing before the breakout unless we see a significant breakout from this range.
If it does occur, consider longing on a retest of the range.
If we see a deviation, consider trimming a bit of your bag on a reentry of the range.
Something to note is the amount of "empty space" between $10 and $20.
19 is the breakdown zone from the 2021 decline, which could be a significant level when considering where price could go if there is a breakout from this range.
The range is also (around) 5 to 10, a 100% increase. If there was a breakout, you could target a 100% advance from 10 - which is again the breakdown zone from 2021 crypto declines.
Thanks for looking.
Cheers

LINK cup and handle breakout. $12 USD by the end of octoberI think LINK is forming a cup and handle formation and is right now in the process of forming a handle which will give us the momentum needed to break out of LINKS long accumulation range.

Chainlink looks super bullish - Keep it simple!Chainlink filled an FVG that was left open for years. Essentially the market retested a key breakout that was in the making for a year. A breakout from a resistance that was tapped three times. That's huge.
But how it did that also matters. LINKUSD formed a range that had a triple top and a triple bottom. Essentially, the market tested the range's top and bottom without entirely breaking the structure. As the crypto market capitulated a few weeks ago, LINK swept its lows, tested the 2019-2020 support (resistance then turned into support), and bounced back above the lows it swept. So what's left now? To take out the highs. What happens next? I don't know. But I am pretty confident the highs will be taken out before we go lower (if we go lower).
The big question is whether it's worth holding Chainlink, Bitcoin, or any other crypto asset. For now, LINK looks pretty clean relative to BTC, as it has probably also capitulated against it. Why? It failed to make a lower low, it's down 89-90% in BTC terms, and it bottomed exactly three years after it topped back in June 2020. Three years is a very long time, and it's an excruciating process that clears out all the weak hands without going through a massive crash.
Here I have to note that Chainlink is one of the most solid projects, with continuous development and a strong fanbase. Fundamentals will start to matter again as regulators clean up the space from all the scams and place reasonable regulations. As institutions really get involved, they will look for projects that have something to show rather than useless tokens with no fundamentals.
Based on my analysis, Chainlink will hit 9-10$ and then potentially rally higher. 9-10$ is the minimum target

Cup and Handle Pattern - Bullish NASDAQ:LINK is looking bullish here as its forming a cup and handle pattern. Looking for NASDAQ:LINK to test resistance. NASDAQ:LINK had been holding up very well in the bear market, and will outperform in the bull market. Get ready. #ccip #quadrillions

Link Bull flag on the daily.BINANCE:LINKUSD Is creating a fantastic Bull Flag on the daily. RSI is low on both daily and weekly. If we Break this weekend/next week, it will trigger the beginning of the Bull Run we expect.

RISING WEDGE - TGT ~7.14R. WEDGE breakout & retest complete. Drop tgt to at least 7.14, which is local support.

CHAINLINK PATH TO 90 USD by Q4 2023.A potential scenario for COINBASE:LINKUSD Based on 2019 repeating pattern.

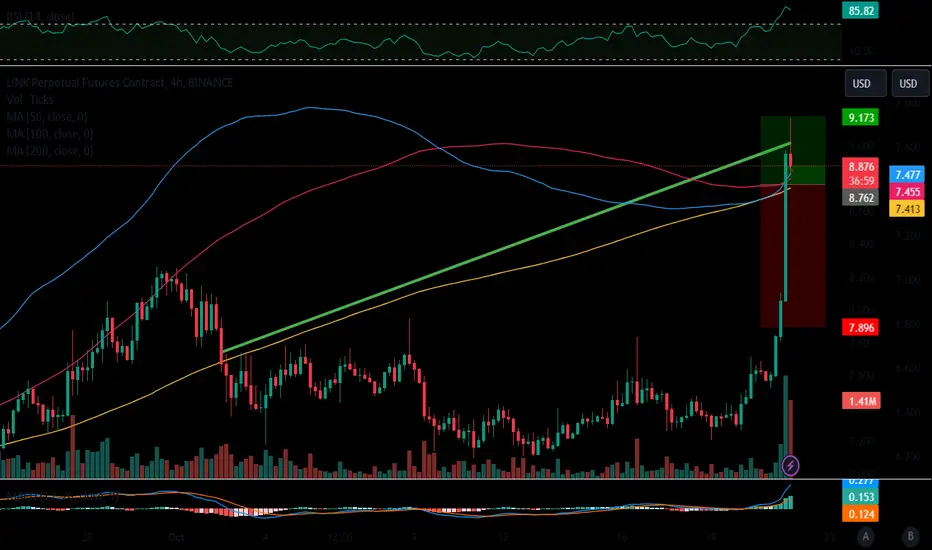
[C-019] ChainlinkTrading idea number C-019 | Chainlink (LINK) may rise to to 8.875 USD area.
The RSI is above its neutrality area at 50. MACD is positive and below its signal line. In addition, price is trading below its 20-period moving average but above its 50-period moving average and pivot point, where we expect a rebound to the R1 point at $9
📈 Long Entry at 7.50
💰 Take Profit at 8.875
💸 Stop Loss at 7.045

Chainlink Roadmap ($200?)(Chart above Green Line - November 2024 , Red Line October 2025)
There are some amazing things happening right now on the Chainlink chart. It may seem like LINK is still in a boring range, but for me, it's quite the opposite. This move down to $5 was the best that could have happened for LINK.
We documented this entire move down to $5, and you can check it out below:
The bar pattern you see in front of you on the main chart above is taken from December 2018 to May 2021. Why so specific in December 2018? Well, if we zoom into the Daily timeframe, you can see a clear mirror pattern appearing. This move down to $5 confirmed to me that, in fact, Chainlink has been playing out a very similar fractal since its first and only bear market, starting from November 2022 (FTX crash).
This is an incredible find! Just look at it; it's undeniable!
The last wave from December 2018 looks pretty much the same as the one we had in June 2023; it even took the same time at the bottom and to pump back up to the range high.
The only major difference here is that in December 2018, this final wave set a higher low, but this year we set a lower low:
Now, let's talk about Fibonacci time sequences:
I forgot about this time count, in October 2022, I marked it as failed because we didn't get a reaction from it anymore, but I stumbled upon it in an old chart save, and wow, it did, in fact, mark the bottom of wave 5 and pivot up.
If Chainlink does repeat the last cycle, then this October 2023, Chainlink will have a massive run-up to an all-time high:
So, out of the last five Octobers since this chart started in 2017, Chainlink has finished the month positively every time except for the first:
Oct 2017 -55%
Oct 2019 +49%
Oct 2020 +28%
Oct 2021 +19%
Oct 2022 +2.75%
Keep in mind that this chart starts in September 2017, so this October we could see a big move up or the start of it. If Chainlink behaves like the last cycle, it rallies to all-time highs.
Remember that Chainlink broke all the high four times before Bitcoin finished its cycle top:
If Chainlink breaks the 3.618 Fibonacci level four times again, LINK would go over $1000:
I put this outcome as unlikely since it takes a lot more money to move this market cap to those numbers.
This TA assumes that Chainlink will follow more of the Bitcoin cycle, as that's what coins that run through the cycle once and significantly increase the market cap tend to do.
LINK/BTC
This time sequence started everything , put everything in motion for chainlink for me , since then its been right at predicting Chainlink events 100% of the time for years , the next date is April 2024 which happens to be the next Bitcoin halving, things are going to get really crazy around this time expect anything.

A Breakout and a Bull RunBeautiful Cup and handle pattern on the daily. A breakout could be the start of a Bull Run!


Can LINK Reclaim Momentum To Avoid Crashing?Cup and Handle: LINK forms a potential cup and handle pattern in the daily chart.
Approaching EMA: Downtrend is nearing the 50-day EMA.
Overhead Trendline: LINK struggles to challenge the overhead resistance.
Market Volatility: Uptober rally slower than anticipated.
Golden Crossover: 50 and 200-day EMAs sustain a positive alignment.
RSI Indicator: Sharp downfall from the overbought zone.
Breakout Failure: Intensive supply inflow keeps the trendline intact.
Bearish Reversal: Weekly chart shows a strong bearish reversal.
Higher Low: Possibility of a new higher low within the channel.
Bullish Failure: Rise in selling spree warns of a bullish failure.
Crucial Support: Support levels at $7 and $6.50.
Potential Reversal: Slim chances for buyers to reclaim trend control.

WEDGE BREAKOUT ON LINKWE HAS OFFICIALLY WICKED ABOVE THE WEDGE WE HAVE BEEN IN ON LINK FOR THE PAST YEAR!
This is perhaps the long awaited break out for LINK

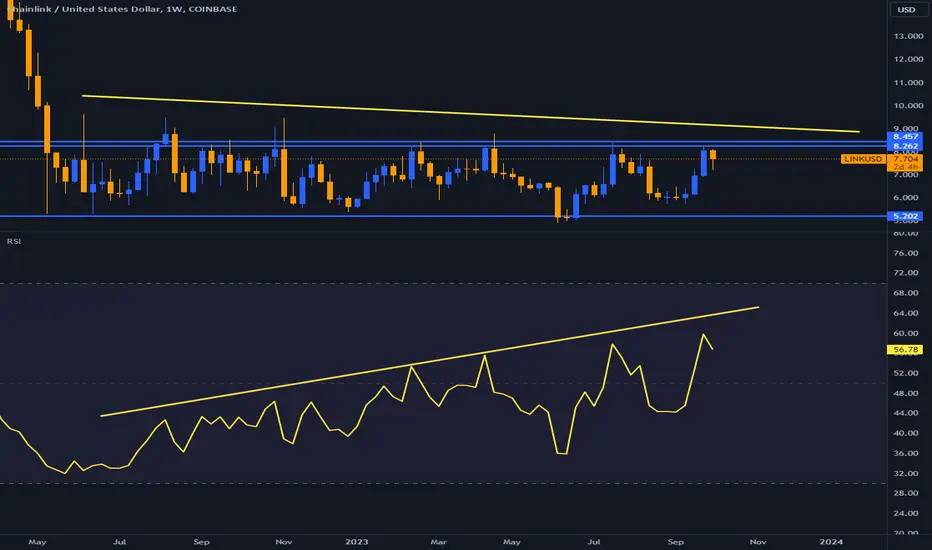
LINK - Quietly Warming Up 👀LINK has not been doing much but it is a coin that many think will have a bright future.
When coins sleep & slump they are a little dangerous but LINK has been sleeping for over a year and its holding well.
It did look a little dicey in the summer but it has recovered well; hopping above the all important yellow 50 week moving average and maintaining sideways drift within the blue trading range.
Now if we look at LINKBTC;
With overlapping lows it is starting to look like a Wyckoff accumulation with the June low not making much price discovery below the May low.
So far it has not exceeded the 50 week moving average other than in a shakeout on the potential AR Automatic Rally bounce.
Its currently challenging that 50WMA again and if it gets above then it could be quite a clue that LINK is entering a bull market.
It is a little choppy here and one way or another we may see LS Left Shoulder Support re-tested to potentially print an Inverted Head & Shoulders Pattern.
If it re-tests LS support on LINKBTC but yet holds above the 50 week MA on LINKUSD then that would be an ideal entry both buying positionally on LINKBTC but also buying into strength on LINKUSD.
This can happen if BTCUSD moves up but LINKUSD continues to drift.
So we are making are first entries here and on a re-test of the 50WMA, then later will look at buying more on a LINKBTC re-test of LS Support.
Not advice

Be carefulPlease, don't chill, don't to be too greedy.
Be careful with it.
There a big bearish hidden divergence in weekly.
LINK Short - Zig Zag, wave C correctionThis looks like it might be a zig-zag correction, with wave C just beginning. I've mapped out expected pattern.

Will LINK Rise Above the Long-coming trendline?Cup and Handle: LINK displays a potential cup and handle formation in the daily chart.
Resistance Challenge: The uptrend is challenging the channel's resistance, hinting at a breakout.
Target Price: LINK aims for the $10 mark upon breakout.
Current Price: Trading at $7.732 with a 4% growth in the last 24 hours.
Bullish Sprouting: The daily candle forms a bullish sprouting, indicating strong momentum.
Golden Crossover: The 50 and 200-day EMAs are teasing a golden crossover.
DMI Indicator: ADX line remains high, reflecting strong momentum, but VI lines struggle to avoid a bearish crossover.
Rounding Reversal: The price action shows a rounding reversal pattern.
Optimistic Sentiment: Market sentiment is extremely optimistic for LINK.
200-Week EMA: A rally could reach the 200-week EMA at $9.065.
Potential to $12.75: A breakout could lead to a price as high as $12.75.
Bearish Risk: A breakdown from $5.85 could restart the bearish cycle, potentially reaching $5.66.

Chainlink Bottom Is In. Range Breakout PendingChainlink BIST:LINK has been in an accumulation range for over 500 days. The breakout is coming soon. My bags are packed.

LINK CHAINLINK: Looks Like A Dump Is Inevitable?It has enjoyed a good ride to $8 in recent days, it looks BINANCE:LINKUSD.P is tired, and dip is around the corner.
Right there on the chart, you have a signal on the entry-level and exit levels.
What is your opinion about this analysis? Share it with me in the comment box.
If this analysis makes sense to you, support my idea and follow me for more.
Cheers!

Run it upSwitching btwn the daily, 4hr, and hell, even weekly and 2hr - all indications say LINK might take a small dip here, but it's probably not too late to catch the next wave up, even if you ain't got nun yet. So run that bagel up fam
