LINK We're close to the support, however, if we go into recession, LINK could go below $1 with the rest of stocks/crypto and other asset classes. Hard to believe but this looks symmetrical and will flush out bag holders before it continues up into 2025.
LINKUSD.P trade ideas

link gannlink gann! consolidating with the gann angles. no price predictions. publishing for record.

Chainlink Chailink Linkusd on the weekly is a continuation of a falling wedge. #link #chainlink BIST:LINK #linkusd

Break Free: ChainlinkWe have a bullish TK Cross and a recently achieved Tenkan Re-test. Bullish
Price above the cloud and we might have a shot at leaving this cursed range to reach 11-14 USD, according to fib levels.
IDEA to be updated.

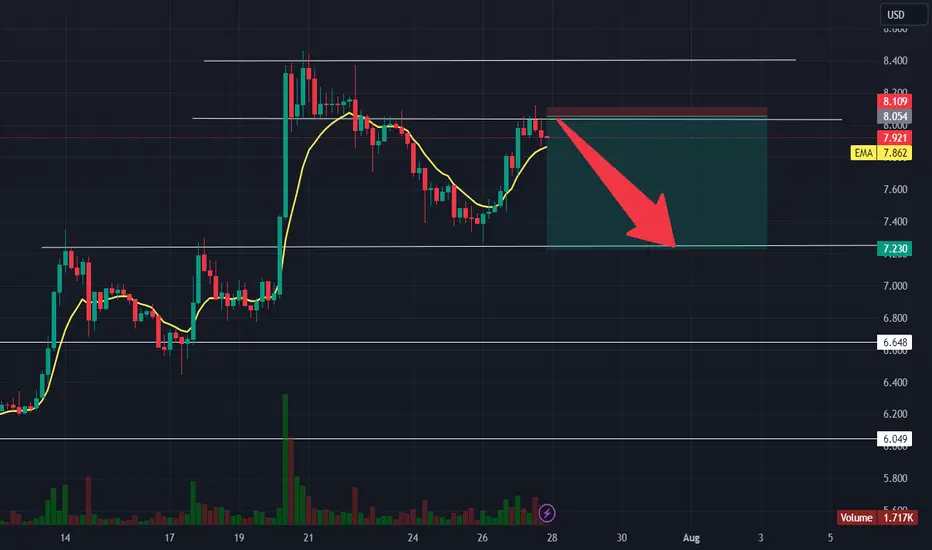
LINK: Is Chainlink Ready for Another Pump?Technically, this is a bullish setup for COINBASE:LINKUSD as there is a bounce of the EMA and Trendling, and this is an area of interest to traders.
I had a look at fundamentals that could invalidate this analysis, but I couldn't find anything, so the bullish bias is intact.
So we have our Stop Loss on $7.2 and we will take profit at $8.5
Once the price gets to $8.1, we move Stop Loss to entry
This is my analysis of LINK
If you like this analysis, kindly follow me now and support my idea
Also, let me know what you think about this analysis through the comment box.
Cheers!

LINKUSD at weekly support...Looking for LINKUSD to hold the weekly and flip the levels we lost. Then we could have a breakout since longs were taken out. Enter after the flip because it hasn't done anything bullish yet and the markets are still in a tailspin.

Is Chainlink In A Ascending Triangle?Please feel free to leave your opinion. It is my first ever TA.

CHAIN LINK BIG MOVEAs you can see their is a broadening ascending wedge forming beautifully on LINK.
I believe price will shoot up around 10.0 to 12.0 in the near future with a few small pull backs along the way.
I hope you find this helpful.
THANK YOU FOR READING !


LINKUSDTHello Traders,
The current condition of the LINKUSDT pair at its 4-hour support
you can long position.
but has not bounced back or retested the area.
there is potential to make a falling wedge but a lot of noise for this pair
Please add a comment and Positive feedback and
constructive criticism are important to authors and the
community.

Short ideaLink should keep going in this Descending channel, will keep dropping in this channel and in a few days if It failed to get a new lower bottom, we can open a LONG position

LINKUSDTHello Traders,
The current condition of the links pair at its 4-hour support
you can long position.
but has not bounced back or retested the area.
there is potential to make a falling wedge but a lot of noise for this pair
Please add a comment and Positive feedback and
constructive criticism are important to authors and the
community.

CHAINLINK/LINKWaiting below atleast at 5$ per coin.
This idea base on liquidity, dont be a liquidity.
Trade it or hold it. THis is not a financial advice. Follow for more daily ideas and contents

$LINK; LONG SETUP- PENDINGHello friends,
This is a free of charge BIST:LINK setup for everyone to share and enjoy. However, this is PENDING and AWAITING for more confirmation. I will update all when the trade is a go and or no go.
Arguments- A beautiful bullish pat pattern has flew from the caves and printed a local double bottom right around the .786 fib which is the GOLD standard when looking for areas of potential reversal.
Now, we are above a infliction point, HOWEVER it is still awaiting that confirmation hence why the trade is still PENDING, as of now.
We see on the oscillator's that regular class a bullish divergence has also developed and is in the process of follow through i.e price action. My stop loss shouldn't be your standard, as everyone has different strategies, however this is something that I would do.
This is not trading advise and this trade is not active. This is me sizing up an asset and waiting for the alert to hit send ;)
GLHF

LINK! Confirming Initial Spring; UPSIDEOHHHH boy. This is where a position would be placed with a very small amount of risk.
Springs, backtests the spring successfully=continuation
Looks reallllllll goood

4HR: $LINK; Sizing Up- Too Much Demand?BIST:LINK at a key inflection point where sellers are trying to push price down, however buyers seem to be soaking up the demand and I would say it is a range bound asset between these areas. I pointed out 2 times via prior history where the demand shows to be too much for bears to bring down, as buyers push for a 10% mark-up once confirmation is in.
IF BIST:LINK can confirm that these lows are in fact the bottom of the range i.e the potential double bottom, history shows that link typically swings upward of 10% once the bottom is hit and support broken/confirmed
Just my thoughts and how one would use history to size up a asset and possibly put in a position and the arguments why.
Thanks for reading

LINKUSD LINK USD CRYPTO CFD on PEPPERSTONE
Higher local rejections aren't marked because they appear to be tested, if you're doubtful, mark them yourself.
Initial lows, supports, untested spots marked with hotpurple box. Testing support currently, also a local low has been created, either we regain it and hold to continue with the move up.. or more likely, break below and push on to retest initial lows that created this whole trend up.
Always refreshing charting a different ticker, removes imprinted biases, lets you acknowledge key spots, and removes all the bs.
Anyways, i'll be watching this ticker over the next week or two. Once again LINKUSD LINK USD CRYPTO CFD on PEPPERSTONE
gravy

1HR: $LINK; Bullish Rectangle- BOUNCE!NASDAQ:LINK did not let the bears break her down past this strong support and produced a nice bullish rectangle driven by bullish divergence on the MACD. IF LINK can spring, backtest local top of the structure and buyers demand, could make a good move.

LINK- long setup- waiting time is around 3 monthsplanning to wait for around 3 month before i go long on the link if the historical pattern from Jan- April 2019 repeated in real time.
i will use the weekly time frame to trade this trading set up.
will update in 8 weeks.

#link shorthello everyone, link just got rejected from the upper resistence. now we can expect a pull down little below we can open a short position.
Chainlink Update (The same playbook )Since October 2022 I have been getting things wrong with chainlink a lot , pretty much the only coin where I missed the target and time over and over . Most of the time its easier to trade Litecoin because it actually has organic movement.
Chainlink has not been moving organically in my opinion , there is no historical price movement that we can compare this sideways movement for over 400 days.
For me atleast it was looking like this was some sort of wyckoff accumulation period and we just had a spring event.
In my previous TA I tried to give traders a heads up that this was highly likely a coordinated move to get Chainlink at much lower prices.
It was very clear to me that this was the case just based on the wave of news and timing of the flash crash structure that came shortly after.
Its the same playbook over and over if its not a ETF to bring price up , its SEC hammer to bring it down or "China ban" or Elon musk selling btc holdings for tesla etc etc you get the picture.
So where are we now , still under the 1/2 Gann Fan , at 6.8 dollars Chainlink will be over the 1/2 Gann Fann , lets see if its start closing above it that would signal a big change for LINK in terms of market structure.
We also have this very nice support line here which until now I didn't notice , seems to be bouncing off this support for a long time.
As I posted in my previous post of LINK , my indicators have been flashing bullish divergence and 5 wave counts across the board.
This EW count suggests wave 5 is in and target is just under 8/1 Gann Fan , very interesting.
and finally we have the most important Chainlink chart , the LINK/BTC dominance last LINK TA I talked about potential hidden bullish divergence if it bounced on this trendline.
We got that bounce.
So to conclude here , never sell your Chainlink at these levels , there is clearly big things happening in the background , when a coin has coordinated attacks to dump price and goes into some sort of Wyckoff accumulation its extremely bullish long term it might not seem that way short term and its been a long road for LINK holders but the play in a bear/sideways market is always to load up on fundamentals .

Chainlink with plenty of Upside Potential1. Clear Accumulation after mark-down phase.
2. Weekly RSI Breakout & successful Retest.
3. Mark-up Phase due given where we are in the long term trend/cycle.

LINK Close to the $8 CrossroadsLINK Price action maintains a sideways trend in the weekly chart.
The recent 60% recovery within the channel faces resistance above $8.
Since last October, prices are yet to close above and test the resistance trendline.
However, the prices are yet to close above it.
If the prices manage to close above $8, Link prices can jump to $8, we can expect it to reach $9, close to the resistance trendline.
On the flip side, an evening start at $8 can restart a bear trend.
